05 | Verschiedene Zielgruppen und deren Probleme im Zusammenhang mit Mikronährstoffen

In meinen bisherigen Recherchen hatte ich mich intensiv mit verschiedenen Problemen im Zusammenhang mit Mikronährstoffen und deren Mängeln beschäftigt und auch wenn es in diesem Themenbereich viele Probleme gab, war es doch schwer, ein Problem herauszupicken, welches insbesondere die Diätolog:innen, welche ich als Zielgruppe definiert hatte, auch gelöst haben wollten.

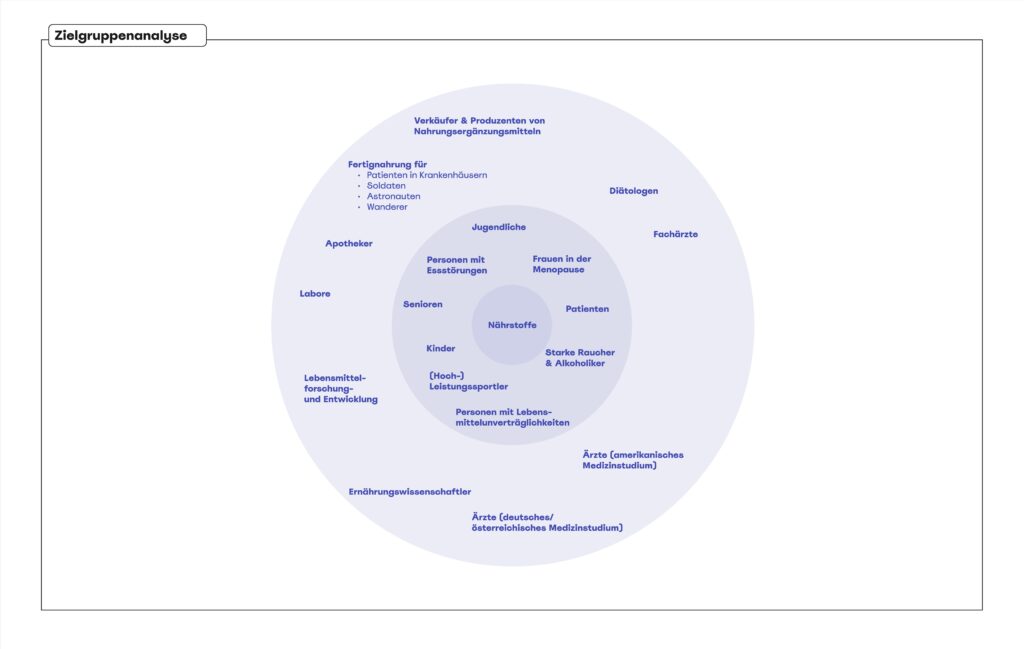
Nach meinem Interview mit FH-Prof. Berner und den Erkenntnissen aus meiner bisherigen Recherche beschloss ich, meinen Fokus zu erweitern. Ich begann, verschiedene Zielgruppen zu analysieren, die von optimierten Lebensmitteln profitieren könnten. Insbesondere interessierten mich Personengruppen mit spezifischen Ernährungsbedürfnissen, wie Kinder, ältere Menschen und sportlich aktive Personen. Diese Gruppen haben unterschiedliche Anforderungen an ihre Ernährung, und ihre Bedürfnisse werden oft nicht ausreichend berücksichtigt.

Daher bin ich im Folgenden und vor allem auch nach meinem Interview mit FH-Prof. DI Dr.-Ing. Simon Berner noch einmal einen Schritt zurückgegangen und habe mir die verschiedenen Zielgruppen noch einmal genauer angeschaut. Wen habe ich möglicherweise übersehen? Gibt es Zielgruppen, welche ebenfalls Probleme mit Mikronährstoffen haben könnten, auf die ich bislang noch (zu) wenig geachtet habe?

Personen mit Lebensmittelunverträglichkeiten

Eine Zielgruppe, die mir während meiner Recherche besonders ins Auge fiel, sind Personen mit Lebensmittelunverträglichkeiten. Diese Menschen haben oft große Schwierigkeiten, geeignete Lebensmittel zu finden, die ihre Unverträglichkeiten berücksichtigen und gleichzeitig alle notwendigen Nährstoffe liefern. Lebensmittelunverträglichkeiten können das Leben erheblich erschweren, da sie nicht nur die Lebensmittelauswahl einschränken, sondern auch das Risiko gesundheitlicher Probleme erhöhen, wenn nicht die richtigen Nährstoffe zugeführt werden.

Mikronährstoffe und Lebensmittelunverträglichkeiten: Warum Betroffene oft Schwierigkeiten haben

Menschen mit Lebensmittelunverträglichkeiten und Allergien stehen häufig vor besonderen Herausforderungen, wenn es darum geht, eine ausgewogene Ernährung sicherzustellen. Diese Schwierigkeiten können zu einem Mangel an wichtigen Mikronährstoffen führen.

  1. Eingeschränkte Lebensmittelauswahl:
    Viele Betroffene müssen bestimmte Lebensmittelgruppen meiden, um allergische Reaktionen oder Unverträglichkeitsbeschwerden zu vermeiden. Dies schränkt die Auswahl an verfügbaren Lebensmitteln erheblich ein und kann dazu führen, dass bestimmte Mikronährstoffe, die in den gemiedenen Lebensmitteln enthalten sind, nicht in ausreichender Menge aufgenommen werden.
  2. Unausgewogene Ernährung:
    Da bestimmte Lebensmittel vermieden werden müssen, kann die Ernährung unausgewogen werden. Beispielsweise könnten Personen, die auf Milchprodukte verzichten müssen, Schwierigkeiten haben, genügend Kalzium und Vitamin D aufzunehmen. Ähnliches gilt für Menschen, die glutenhaltige Getreide meiden und möglicherweise weniger Ballaststoffe, B-Vitamine und Eisen zu sich nehmen.
  3. Mangel an Aufklärung und Wissen:
    Nicht alle Betroffenen sind sich der potenziellen Mikronährstoffmängel bewusst oder wissen, wie sie diese ausgleichen können. Ohne das richtige Wissen und die richtigen Ressourcen ist es schwierig, eine vollständig ausgewogene Ernährung zu gewährleisten.
  4. Soziale und praktische Hindernisse:
    Essen außer Haus, Reisen oder gesellschaftliche Ereignisse können zusätzliche Herausforderungen darstellen. Die Verfügbarkeit geeigneter Lebensmittel ist oft eingeschränkt, was dazu führt, dass Betroffene Kompromisse eingehen müssen, die ihre Nährstoffaufnahme beeinträchtigen können.

Zusammengefasst erfordert die Ernährung für Menschen mit Lebensmittelunverträglichkeiten und Allergien besondere Aufmerksamkeit und Planung, um sicherzustellen, dass alle notwendigen Mikronährstoffe in ausreichender Menge aufgenommen werden. Eine gezielte Unterstützung könnte Betroffenen helfen, diese Herausforderungen besser zu meistern und ihre Ernährung optimal zu gestalten. Diese Erkenntnis führte mich zu der Frage, wie Menschen unterstützt werden können, die nicht unbedingt bestehende Mängeln haben, sondern vielmehr Gefahr laufen, durch „Krankheiten“ und unfreiwillige Diätformen in der Zukunft einen Mangel zu entwickeln.

04 | Reflexion des Interviews

Obwohl ich die technische Präzision und die Methoden beeindruckend fand, die im Department für Engineering an der FH Joanneum ihren Einsatz finden, musste ich feststellen, dass diese Ansätze für mein Forschungsthema wenig Anhaltspunkte boten. Insbesondere, weil die Projekte und Arbeiten, die mir vorgestellt wurden bereits sehr ausgereift und selbst die Prototypen beinahe Marktreif ausgearbeitet waren, empfinde ich es als äußerst schwer, direkt für dieses Institut, bzw. einen der im Interview besprochenen Projekte einen Low Fidelity Prototypen umzusetzen.

Die ingenieurmäßigen Ansätze waren zwar faszinierend, aber sie schienen sich hauptsächlich auf die technologische Optimierung und industrielle Produktion zu konzentrieren, ohne tiefere nutzerzentrierte Analysen der spezifischen Bedürfnisse verschiedener Zielgruppen zu bieten. Dennoch war das Interview äußerst spannend und aufschlussreich für mich, da es mir noch einmal vor Augen geführt hat, wie vielfältig und breit mein Themenbereich ist und wie viel sich in diesem Thema machen lässt. So kam es insbesondere dazu, dass ich mir die möglichen Zielgruppen und deren Bedürfnisse und Probleme noch einmal genauer angeschaut habe.

Thinking in Components

In this blog post, I’d like to touch on a general web design practice, that shows it’s important in map design as well. Building a complex map like Vanlifezone’s requires a framework to build with. Although technically possible with vanilla HTML, CSS, and JavaScript, a framework like NextJS takes care of a lot of pain points, like SEO, caching, server-side rendering and client-side loading.

NextJS, the framework I’m building the map with, is based on React, a JavaScript library for building user interfaces. React is built around the concept of components, which can be thought of as reusable pieces of code. Using components, complex user interfaces can be broken down into smaller, more manageable parts.

Similarly, when designing a more complex interface, components should be used for reusability across different areas of the UI. For me, it was important that these components reflect the same code-based React components in the repository. This insures that I can design the UI the same way I code the map.

One such example is the location popup card, which shows more detailed information about a location after it is clicked on. Without user testing, I can only make informed assumptions and heuristic evaluations for deciding what type of information to display on this popup. But having been on vanlife adventures myself, I have a decent grasp on what info is necessary during these types of travels.

Of course I also want to keep the goals of Vanlifezone.com in mind, both for building a community of active users and financing the project. Because of this, we have decided that businesses can pay to have their business displayed more prominently on the map, and also have additional information in their popup.

Below is a first version of how this popup looks like – it includes:

  • Icon/profile picture for the location type
  • Name of the location
  • Location type
  • A list of features and/or amenities
  • Descriptive text
  • One or multiple relevant pictures
  • Source (User, OSM, etc.) and verification status (Paid partner, verified by community, unverified)
  • A row of buttons for routing to, sharing, or viewing the location in more detail

I am writing this blog post a few weeks after this design has been made, and already there are some considerations for information that might be important to include. During early user testing it was pointed out that pricing information and availability (relating to camp sites) is valuable and often tricky to find, due to seasonal pricing. The amenity could also have better visualizations of the availability of amenities, and contact information could also be useful to include in the popup. This led to a newer version of this popup (still excluding pricing and availability information). Note that the buttons at the bottom are also variable, depending on what information is available.

Of course, this is only the start. As more testing is done, I will have to adapt the design and functionality of this and other components.

09 – “Story Teller” – Prototype Development

Introduction

After conducting a thorough analysis of different research papers and exploring various existing authoring tools, I embarked on the journey of developing my own prototype. This process involved the examination of the strengths and weaknesses of each tool, as well as an in-depth understanding of the theories and methodologies presented in each research paper. With this knowledge, I then proceeded to apply what I had learned to the creation of my prototype. The objective of this blogpost is to document the process that I underwent during the prototyping phase.

Methodology

I began by listing all the sections I wanted to reimplement from StoryTec, including the G-Flash card system and Story Curve Visualization mode.

  • Story Editor: This is a free canvas where users can drag, resize, move, and zoom in and out of elements.
    • Scenes: These contain characters, interactive elements, and behaviors such as actions, dialogue, and events.
    • Complex Scenes (which I’ll refer to as Stages): These are the environments where scenes take place. They contain stage-specific elements and, of course, the scenes themselves.
  • Stage Editor: In StoryTec, this was a pluggable framework capable of constructing scenes in various ways. For ease of use, I will integrate this as a function of the Story Editor, utilizing a toolbar with drag-and-drop flashcards, similar to G-Flash. In my version, the cards will be fully customizable through the Property Editor.
  • Property Editor: This is a separate tab that adapts based on the selected item. It can add any kind of property to any element.
  • Action Set Editor: In StoryTec, this was a separate editor for setting the logic between element interactions. In my prototype, it will become a button in the Tool tab, connecting elements similarly to how Figma handles prototyping.
  • Asset Manager: A separate tab where uploaded assets can be dragged and dropped either onto the open canvas as images, videos, or sound, or onto elements as properties.
  • Story Curve Visualization: This is an option in the top bar that changes how the scenes are displayed, toggling from the free canvas to a double-axis view of the Story Curve.

After identifying the core features and buttons for my tool, I sketched a basic information architecture on paper. Following this, I created preliminary wireframes to visualize the page’s layout.

Pages, tabs and cards

Starting from the sketches, I prototyped a low-fidelity version of the main pages for my authoring tool.

The home page displays all the stories that a user might want to create, presented in a straightforward gallery.

Each Story file features an „infinite“ zoom canvas where elements, cards, and assets can be dragged and dropped, resized, opened, and minimized. This design maximizes flexibility of thought.

When an element is clicked, the Properties tab displays all details of that specific instance, and allows the creation of new properties if necessary. These properties can be used and referenced as logic variables when establishing connections between elements.

The Stage button in the Bottom Tool Bar offers two main interactions: the New Stage card and the Element card. Both can be dragged onto the canvas and resized to create the desired composition.

Similarly, the Scene button in the Bottom Tool Bar enables the user to draw a new scene or select one of the cards for characters, elements, or behaviors.

Finally, the Story Curve View visualizes different scenes on the Narration order/Story order axis. You can personalize this visualization using the settings tab.

Goals & Conclusion

The main goal of this prototype is to thoroughly test the usability of various complex features, particularly for beginners and new storytellers. I aim to conduct an extensive user test to gain insights into whether the basic principles of User Experience (UX) are being followed and function as intended.

After initial testing and result analysis, I’ll create a higher fidelity prototype. This version will focus more on the user interface, using feedback from the initial tests to ensure a smoother, more intuitive user experience.

In my next blog post, I’ll show the main features of this prototype through a detailed demo video. This will help me show the tool’s functionality and potential.

08 – Trevor Paglen’s “Cyclops” – A complex ARG for a complex storytelling

Introduction

In the realm of digital storytelling, few experiences are as intricate and immersive as „Cyclops,“ an alternative reality game crafted by artist Trevor Paglen. „Cyclops“ serves as a masterclass in nonlinear, interactive narrative, demanding a blend of diverse knowledge areas from its players. This makes it an ideal case study for my authoring tool, which is designed to enable the creation of complex, multifaceted stories that engage audiences in unique and profound ways. Through this blog post, I want to explore how „Cyclops“, with its sophisticated storytelling structure, perfectly aligns with the capabilities of a robust authoring tool.

Summary

„Cyclops“ is an intricate and intimidating alternative reality game designed by artist Trevor Paglen. It features a basic black-and-white digital interface reminiscent of 1970s computer systems and demands extensive knowledge in fields like cryptography, vintage computers, logic, music, and PSYOPS history. Launched at the 2023 Chaos Communication Congress, it required 700 professional hackers three days to reach just the fourth level. Since then, a dedicated group on Discord has continued to collaborate, achieving 53% completion of level three. The game immerses players in complex puzzles and psychological challenges, often guided by Eliza, a reference to the first chatbot, enhancing the sense of psychological warfare.

Paglen’s goal was to create a public art project native to the online world, fostering a community united by shared interests in digital security and coded messages. Cyclops prompts players to reflect on their relationship with digital media and social interactions, blurring the lines between gaming and psychological manipulation. Paglen and his team of experts spent a year developing this intricate digital landscape, which echoes the haunting possibility that today’s internet might be an extension of historical psychological control programs like MK Ultra.

My Conclusions

The main reasons why “Cyclops” is a suited as a case study for my project are:

  • Its Complex Narrative Structure: „Cyclops“ features a nonlinear storyline that challenges players to navigate through cryptographic puzzles, vintage computer systems, and psychological tests. This complexity requires an authoring tool that can handle multiple narrative branches and interconnected storylines seamlessly.
  • Interactive and Immersive Elements: The game’s integration of various media forms, such as audio tracks, ASCII scripts, and visual puzzles, demonstrates the need for an authoring tool capable of embedding diverse interactive elements that enhance user engagement.
  • Collaborative Problem-Solving: „Cyclops“ necessitates collective intelligence and collaboration, which can be facilitated by an authoring tool that supports multi-user interaction and real-time collaboration features. This feature would go outside of the pure realm of an authoring tool for storytellers but could be an interesting future feature to give the player of any ARG a platform where they are able to collaborate, solve and piece together the story that the artist is trying to convey.

References

https://donotresearch.substack.com/p/artist-profile-trevor-paglens-cyclops

07 – Authoring Tools for Storytelling – G-Flash, StoryTec & Story Explorer

Introduction

In my research for case studies on tools for storytelling I’ve read and analysed the two following papers, „G-Flash: A Simple, Graphical Authoring Environment for Interactive Non-Linear Stories“ and „StoryTec: A Digital Storytelling Platform for the Authoring and Experiencing of Interactive and Non-linear Stories“. They provide insightful perspectives on authoring tools designed for different user groups. These tools vary significantly in complexity and user experience, offering valuable insights for developing a prototype authoring tool for interactive, non-linear storytelling. My goal is to gather the insights from these research papers and use them to design my prototype. Furthermore, I will use insights from the research paper “Visualising Nonlinear Narratives with Story Curves”, already discussed in the previous blogpost, to have in mind clear UX goals for my prototype.

Summary

G-Flash and StoryTec are both digital storytelling platforms designed to support the creation of interactive and non-linear stories, but they differ in their specific features and approaches.

G-Flash, as described by Jumail et al. in 2011, focuses on providing guided learning and assistance to young children in creating digital stories using flashcards as the main media element. It emphasizes the tutored approach to guided learning, allowing students to receive the right amount of assistance without compromising their creativity and motivation. The system architecture of G-Flash is Flash-based and web-based, with a focus on using illustrated flashcards to guide story creation.

On the other hand, StoryTec, as introduced by Göbel et al. in 2018, is a digital storytelling platform that enables the authoring and experiencing of interactive and non-linear stories. It provides an authoring environment with different editors for creating and manipulating story units, as well as a runtime engine for controlling interactive scenarios during runtime. StoryTec also includes a Story Editor for managing story structures and an Action Set Editor for defining transitions among scenes..

In summary, G-Flash focuses on providing guided learning and assistance to young children using flashcards, while StoryTec is designed to enable the creation and visualization of interactive and non-linear stories through its authoring environment and runtime engine.

Both platforms aim to facilitate the creation of digital stories, but G-Flash emphasizes guided learning for children, while StoryTec provides a comprehensive authoring framework for interactive and non-linear narratives.

My conclusions

From G-Flash, I could incorporate the concept of guided learning and assistance giving within the digital storytelling application to help beginner creative writers. This can be achieved by providing a tutored approach and using flashcards-like visuals as a media element to guide story creation. According to the study, the use of illustrated flashcards motivates children and helps them recall their experiences; this can be a valuable feature to include in my authoring tool to improve recall of more complex events in a non-linear story.

From StoryTec, I can take the focus on a user-friendly and intuitive graphical user interface (GUI) for the authoring environment to help beginner creative writers without programming skills to create interactive stories. Additionally, the separation of story structure and story content in StoryTec can be a valuable insight to consider when developing your authoring tool, as it allows for flexibility in creating and playing different story elements based on the same structure. A runtime engine for the interactive storytelling platform would be interesting to implement but requires more research.

To enhance the user experience, I want to incorporate the visualization technique of Story Curves, [Blogpost 6] to reveal nonlinear narrative patterns and provide a helpful overview of the story structure. This visualization method can be used to help beginner creative writers understand the nonlinear narrative patterns in their stories and provide a visual representation of the story’s structure. I am going to take in consideration UX issues discussed in the Story Curve paper regarding the Story Explorer tool:

  1. Readability and Learnability: The evaluation of Story Explorer highlighted that some participants had difficulty in reading both story and narrative order at the same time. This suggests that providing a clear distinction between different narrative orders and visual aids for reading two axes could be useful for reading story curves.
  2. Control of Origin and Time Jumps: Participants in the evaluation study of Story Explorer struggled with the initial disorientation caused by the placement of the origin at the upper left corner and confusion between flashforwards and flashbacks. The analysis suggested that providing control of the origin of the axes and visual aids for time jumps could improve user experience.
  3. Scalability and Clean Visualization: Story Explorer integrated mechanisms to ensure a clean and scalable visualization, even for stories with hundreds of scenes. The semantic zoom feature with different representations for story elements was identified as a key factor in preventing clutter in the story graph representation.

In conclusion, by combining the insights from G-Flash, StoryTec and Story Explorer I can develop an authoring tool that provides guided learning, assistance giving, and a user-friendly interface for creating interactive, non-linear stories using the Story Curves visualization Method.

References

  1. Jumail, D. R. A. Rambli and S. Sulaiman, „G-Flash: An authoring tool for guided digital storytelling,“ 2011 IEEE Symposium on Computers & Informatics, Kuala Lumpur, Malaysia, 2011, pp. 396-401, doi: 10.1109/ISCI.2011.5958948.
  2. S. Göbel, L. Salvatore and R. Konrad, „StoryTec: A Digital Storytelling Platform for the Authoring and Experiencing of Interactive and Non-Linear Stories,“ 2008 International Conference on Automated Solutions for Cross Media Content and Multi-Channel Distribution, Florence, Italy, 2008, pp. 103-110, doi: 10.1109/AXMEDIS.2008.45.
  3. N. W. Kim, B. Bach, H. Im, S. Schriber, M. Gross and H. Pfister, „Visualizing Nonlinear Narratives with Story Curves,“ in IEEE Transactions on Visualization and Computer Graphics, vol. 24, no. 1, pp. 595-604, Jan. 2018, doi: 10.1109/TVCG.2017.2744118.

06 – Visualizing Nonlinear Narratives with Story Curves

Introduction

In the realm of digital storytelling, presenting nonlinear narratives can be particularly challenging due to their complex structures and the intricacies involved in their visualization. The paper „Visualizing Nonlinear Narratives with Story Curves“ introduces an innovative approach to tackling this issue through the development of story curves and the Story Explorer tool. As I move on into the creation of my prototype, the insights from this paper will be instrumental in shaping the way I visualize and manage nonlinear narratives. By integrating story curves into my prototype, I aim to enhance the user’s understanding and interaction with complex storylines, providing a more intuitive and engaging experience.

Summary

The paper introduces story curves, a visualization technique designed to reveal patterns in nonlinear narratives by mapping events in a two-dimensional plot based on their chronological and narrative order. The core component of this system is the Story Explorer, an interactive tool that allows users to curate and explore the chronological sequence of scenes in a movie script. The Story Explorer parses scripts to extract scenes, characters, and metadata, presenting them alongside the story curves for a comprehensive view of the narrative structure.

A schematic diagram showing how to construct a story curve from a sequence of events in story and narrative order (left). An example of a story curve of the movie Pulp Fiction (right) showing characters (colored segments), location (colored bands), and day-time (gray backdrop). A nonlinearity index is calculated based on the degree of deviation of narrative order from actual story order.

User tests were conducted to evaluate the readability and learnability of story curves. Participants were asked to answer questions regarding pattern recognition within the story curves, and the results indicated a generally high level of comprehension, with an average correctness rate of 80%. The tests highlighted some challenges, such as the simultaneous interpretation of both story and narrative orders, but overall demonstrated the effectiveness of story curves in conveying complex narrative patterns.

The goals of these tests were to assess the practicality of story curves in real-world applications and to identify areas for improvement. The results showed that story curves are a valuable tool for screenplay analysis, education, and film production, offering new perspectives on narrative structures that were previously difficult to visualize. The feedback from professional writers and scholars further emphasized the potential of story curves to revolutionize the way nonlinear narratives are understood and created.

My conclusions

Story Curves are a type of narrative visualization that is able to help both novice and experienced storytellers build a coherent non-linear narrative in, potentially, any kind media of their choice (ARG, video, web, installation, etc.).

With an improved version of Story Explorer new narrative patterns could arise due to new variables, such as media and readers interaction with the story. Adding new feature related to the challenges of multiple media and community creation would be a very interesting topic to explore and could be the ground for my digital prototype.

References

N. W. Kim, B. Bach, H. Im, S. Schriber, M. Gross and H. Pfister, „Visualizing Nonlinear Narratives with Story Curves,“ in IEEE Transactions on Visualization and Computer Graphics, vol. 24, no. 1, pp. 595-604, Jan. 2018, doi: 10.1109/TVCG.2017.2744118.

First VR Training Prototype

Introduction

As a novice in VR development, creating my first prototype for gamified VR training was both a challenging and enlightening journey. This project focused on developing a simple yet interactive training module that incorporated various user interactions and gamification elements. Here’s a look at the design and the learning process involved.

Prototype Overview

For my first prototype, I designed a VR training module where users interact with different shapes and perform tasks using various controls. The goal was to create an engaging and educational experience that could be used for training purposes. Here are the key components of the prototype:

Key Interactions

  1. Changing Cube Color
  • Interaction: Users can press a button to change the color of a cube.
  • Gamification: Each time the cube changes color, the user earns 1 point.
  • Feedback: Immediate visual feedback shows the color change, and the points system provides motivation to continue interacting.
  1. Moving the Cube with a Joystick and Stepper
  • Interaction: A joystick allows users to move the cube around the VR environment.
  • Learning Objective: This helps users practice fine motor skills and control within the VR space.
  1. Smashing the Cube with a Hammer
  • Interaction: Users can use a virtual hammer to smash the cube.
  • Engagement: This fun and interactive element keeps users engaged and helps relieve stress while practicing precision and coordination.
  1. Placing the Cube in the Correct Box
  • Interaction: Users must move the cube and place it into the correct box.
  • Feedback: Sound feedback is provided to indicate if the cube is placed in the correct or wrong box, enhancing the learning experience through auditory cues.

Gamification Elements

  1. Points System
  • Users earn points for successfully changing the cube’s color and completing tasks.
  • The points system adds a competitive and motivational aspect to the training, encouraging users to improve their performance.
  1. Visual and Sound Feedback
  • Visual Feedback: Immediate color changes and placement indicators help users understand their actions.
  • Sound Feedback: Auditory cues indicate correct or incorrect actions, reinforcing learning and improving task accuracy.

Learning Experience

Developing this prototype was a significant learning experience. The process involved understanding how to create interactive elements within a VR environment and effectively implementing gamification mechanics. Despite being a beginner in VR development, I learned to design simple interactions that provide immediate feedback and keep users engaged.

Conclusion

My first VR training prototype successfully integrated basic gamification elements to create an engaging and educational experience. By allowing users to interact with different shapes, change colors, move objects, and receive immediate feedback, this prototype serves as a foundational step towards more complex VR training modules. The challenges I faced and the skills I acquired during this project have been invaluable, and I look forward to further developing and refining my VR development capabilities.

Calm Technology // 19

Since I had scripted the different gestures I wanted to have for Tap in Arduino, I could now combine all the gestures into one script. I then connected the Wemos board that controls Tap to the wifi so that I could trigger each of these gestures wirelessly from my laptop via a simple interface.

To create the interface, I used Max 8 to build a simple patch to send OSC messages to my Wemos board. The patch consists of a few buttons that trigger messages with a value between 0 & 3, which are then sent as an OSC message via UDP to trigger different parts of the Arduino script.

Max patch interface to control tap

I combined all the different gesture scripts into one Arduino script that can receive OSC messages via UDP. These messages set the value for a variable which is then queried in the loop of the script to start the desired gestures. After the gestures have finished, the variable is reset to put Tap back into a suspended state.

#include <AccelStepper.h>
#include <ESP8266WiFi.h>  // The Library for WIFI
#include <WiFiUdp.h>  // Library for UDP
#include <OSCMessage.h>  //Library for OSC

#define motorInterfaceType 1

// Define the stepper motor and the pins that is connected to // (STEP, DIR)
AccelStepper stepper1(motorInterfaceType, D5, D6); 
AccelStepper stepper2(motorInterfaceType, D7, D8);

// Set the target positions for both steppers
int PositionDown = 0;
int PositionUp = 0;

// State variable to keep track of movement sequence
int state1 = 0;
int state2 = 0;

// For triggering movements
int mode = 0;

WiFiUDP Udp;

const char* ssid = "************";           
const char* password = "************";      

const IPAddress dstIp(192,168,1,129); 
const unsigned int dstPort = 7250;  // Destination OSC
const unsigned int localPort = 7300; // Reciving OSC


////////////////////////////////////////////////////////////////////////////////////


void setup() {
  
  Serial.begin(9600);

  // Settings for Motor 1
  stepper1.setMaxSpeed(1000); 
  stepper1.setAcceleration(500);
  stepper1.setCurrentPosition(0);

  // Settings for Motor 2
  stepper2.setMaxSpeed(1000);
  stepper2.setAcceleration(500);
  stepper2.setCurrentPosition(0);

  // Connecting to WIFI
  Serial.print("Connecting WiFi ");
  // Prevent need for powercyle after upload.
  WiFi.disconnect();

  // Use DHCP to connect and obtain IP Address.
  WiFi.mode(WIFI_STA);
  WiFi.begin(ssid,password);

  // Wait until we have connected to the WiFi AP.
  while (WiFi.status() != WL_CONNECTED) {
    delay(500);
    Serial.print(".");
  }

  Serial.println("Done!");
  Serial.print("IP address: ");
  Serial.println(WiFi.localIP());

  Udp.begin(localPort);

}


////////////////////////////////////////////////////////////////////////////////////


void loop() {

  handleOSC();

  if (mode == 0) {

    state1 = 0;
    state2 = 0;

  }

  if (mode == 1) {

    Wave1();
    Wave2();

  }

  if (mode == 2) {
    
    Knock1();

  }

  if (mode == 3) {
    
    Tap1();
    Tap2();

  }

}


////////////////////////////////////////////////////////////////////////////////////


void Wave1() {

  switch (state1) {

    case 0:
      stepper1.setAcceleration(200);
      PositionDown = 40;
      stepper1.moveTo(PositionDown);
      state1 = 1;
      break;
    
    case 1:
      if (stepper1.distanceToGo() != 0) {
        stepper1.run();
      } else {
        stepper1.stop();
        PositionDown = -40;
        stepper1.moveTo(PositionDown);
        state1 = 2;
      }
      break;
    
    case 2:
      if (stepper1.distanceToGo() != 0) {
        stepper1.run();
      } else {
        stepper1.stop();
        PositionDown = 20;
        stepper1.moveTo(PositionDown);
        state1 = 3;
      }
      break;

    case 3:
      if (stepper1.distanceToGo() != 0) {
        stepper1.run();
      } else {
        stepper1.stop();
        PositionDown = -20;
        stepper1.moveTo(PositionDown);
        state1 = 4;
      }
      break;

    case 4:
      stepper1.setAcceleration(100);
      if (stepper1.distanceToGo() != 0) {
        stepper1.run();
      } else {
        stepper1.stop();
        PositionDown = 0;
        stepper1.moveTo(PositionDown);
        state1 = 5;
      }
      break;
    
    case 5:
      if (stepper1.distanceToGo() != 0) {
        stepper1.run();
      } else {
        stepper1.stop();
      }
      break;
  }
}


void Wave2() {

  if (state1 >= 4){

    switch (state2) {

      case 0:
        stepper2.setAcceleration(275);
        PositionUp = 25;
        stepper2.moveTo(PositionUp);
        state2 = 1;
        break;
      
      case 1:
        if (stepper2.distanceToGo() != 0) {
          stepper2.run();
        } else {
          stepper2.stop();
          PositionUp = -25;
          stepper2.moveTo(PositionUp);
          state2 = 2;
        }
        break;
      
      case 2:
        if (stepper2.distanceToGo() != 0) {
          stepper2.run();
        } else {
          stepper2.stop();
          PositionUp = 15;
          stepper2.moveTo(PositionUp);
          state2 = 3;
        }
        break;

      case 3:
        
        if (stepper2.distanceToGo() != 0) {
          stepper2.run();
        } else {
          stepper2.stop();
          PositionUp = -15;
          stepper2.moveTo(PositionUp);
          state2 = 4;
        }
        break;

      case 4:
        if (stepper2.distanceToGo() != 0) {
          stepper2.run();
        } else {
          stepper2.stop();
          PositionUp = 15;
          stepper2.moveTo(PositionUp);
          state2 = 5;
        }
        break;

      case 5:
        if (stepper2.distanceToGo() != 0) {
          stepper2.run();
        } else {
          stepper2.stop();
          PositionUp = -15;
          stepper2.moveTo(PositionUp);
          state2 = 6;
        }
        break;

      case 6:
        if (stepper2.distanceToGo() != 0) {
          stepper2.run();
        } else {
          stepper2.stop();
          PositionUp = 0;
          stepper2.moveTo(PositionUp);
          state2 = 7;
        }
        break;  
      
      case 7:
        if (stepper2.distanceToGo() != 0) {
          stepper2.run();
        } else {
          stepper2.stop();
          mode = 0;          
        }
        break;
    }
  }
}


void Knock1() {

  switch (state1) {

    case 0:
      stepper2.setAcceleration(400);
      PositionUp = -20;
      stepper2.moveTo(PositionUp);
      state1 = 1;
      break;
    
    case 1:
      if (stepper2.distanceToGo() != 0) {
        stepper2.run();
      } else {
        stepper2.stop();
        PositionUp = 80;
        stepper2.moveTo(PositionUp);
        state1 = 2;
      }
      break;
    
    case 2:
      if (stepper2.distanceToGo() != 0) {
        stepper2.run();
      } else {
        stepper2.stop();
        PositionUp = 60;
        stepper2.moveTo(PositionUp);
        state1 = 3;
      }
      break;

    case 3:
      stepper2.setAcceleration(800);
      if (stepper2.distanceToGo() != 0) {
        stepper2.run();
      } else {
        stepper2.stop();
        PositionUp = 80;
        stepper2.moveTo(PositionUp);
        state1 = 4;
      }
      break;

    case 4:
      if (stepper2.distanceToGo() != 0) {
        stepper2.run();
      } else {
        stepper2.stop();
        PositionUp = 0;
        stepper2.moveTo(PositionUp);
        state1 = 5;
      }
      break;
    
    case 5:
      if (stepper2.distanceToGo() != 0) {
        stepper2.run();
      } else {
        stepper2.stop();
        mode = 0;
      }
      break;
  }
}


void Tap1() {

  if (state2 >= 2){

    switch (state1) {

      case 0:
        stepper1.setAcceleration(300);
        PositionDown = -20;
        stepper1.moveTo(PositionDown);
        state1 = 1;
        break;
        
      case 1:
        if (stepper1.distanceToGo() != 0) {
          stepper1.run();
        } else {
          stepper1.stop();
          PositionDown = 5;
          stepper1.moveTo(PositionDown);
          state1 = 2;
        }
        break;
        
      case 2:
        stepper1.setAcceleration(600);
        if (stepper1.distanceToGo() != 0) {
          stepper1.run();
        } else {
          stepper1.stop();
          PositionDown = -20;
          stepper1.moveTo(PositionDown);
          state1 = 3;
        }
        break;

      case 3:
        if (stepper1.distanceToGo() != 0) {
          stepper1.run();
        } else {
          stepper1.stop();
          PositionDown = 0;
          stepper1.moveTo(PositionDown);
          state1 = 4;
        }
        break;

      case 4:
        stepper1.setAcceleration(100);
        if (stepper1.distanceToGo() != 0) {
          stepper1.run();
        } else {
          stepper1.stop();
        }
        break;
      
    }
  }
}


void Tap2() {

  switch (state2) {

    case 0:
      stepper2.setAcceleration(400);
      PositionUp = 50;
      stepper2.moveTo(PositionUp);
      state2 = 1;
      break;
    
    case 1:
      if (stepper2.distanceToGo() != 0) {
        stepper2.run();
      } else {
        stepper2.stop();
        PositionUp = 0;
        stepper2.moveTo(PositionUp);
        state2 = 2;       
      }
      break;

    case 2:
      if (state1 >= 4) {
        stepper2.setAcceleration(200);
        if (stepper2.distanceToGo() != 0) {
          stepper2.run();
        } else {
          stepper2.stop();
          mode = 0;
        }
      }
      break;
        
  }
}


////////////////////////////////////////////////////////////////////////////////////


void handleOSC() {
  
  OSCMessage msg("/Mode");
  int size = Udp.parsePacket();
  if (size > 0) {
    while (size--) {
      msg.fill(Udp.read());
    }
    if (!msg.hasError()) {
      msg.dispatch("/Mode", Activating);
    }
  }
}


void Activating(OSCMessage &msg) {
  
  if (msg.isInt(0)) {
    int receivedMode = msg.getInt(0);
    mode = receivedMode;
    Serial.println("Received Mode Command");
    Serial.println(mode);

  }
}

After finishing the interface and the now complete Arduino script, I tested them together. With my laptop set up as a touch interface running Max 8 and the Wemos board running Tap as usual. All went quite smoothly and after some tweaking everything is now running stable. You can see the result below.

Tap controlled via a remote interface

With this, my prototype for this semester’s Design & Research project is almost finished. The last step will be to make the interface a bit cleaner and more intuitive, and then I will make a video explaining my prototype Tap and how it works.