18 | Final Idea & Paper Prototype

After the last blog post I had a meeting with Birgit Bachler where we talked about the topic. I presented some of my ideas and got useful feedback. Based on the feedback received and my assessment of the potential and feasibility of each idea, I decided on the concept I wanted to further develop.

The final concept I landed on is creating a second-hand app for children’s shoes. There are multiple second-hand apps on the market, but there are none dedicated for children’s shoes. I focus on this user group because children continuously grow, and so their shoe size is constantly changing and there is a rapid change of shoes. There are for that reason a big potential for second-hand children’s shoes. This approach is not only more sustainable, but also cheaper. After discussing the idea with Bachler, we concluded that second-hand children’s shoes might be more acceptable than adult shoes, given the different hygiene concerns associated with used footwear. Another advantage of a second-hand app dedicated to shoes is that it might be easier to find the exact type of shoe that you are looking for, being able to filter on different shoe types.

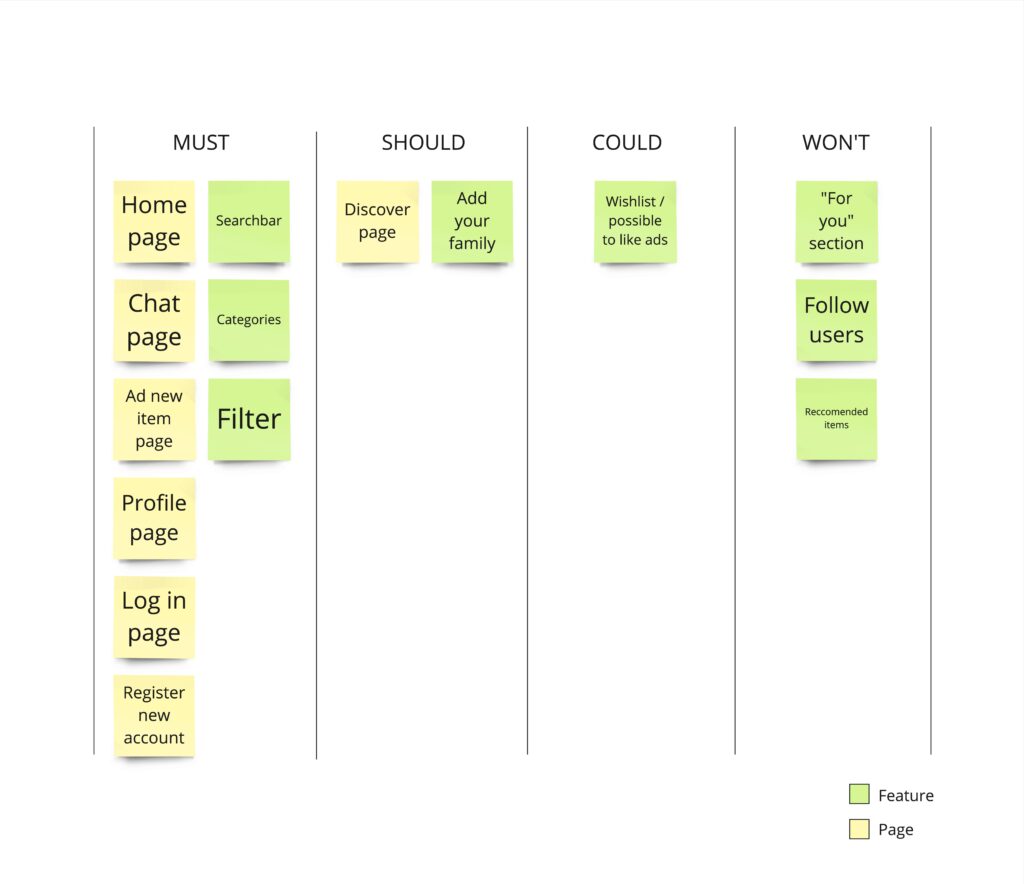
After deciding on the concept, I started thinking about what features this app should contain and I searched for inspiration from other second-hans apps. I created a MoSCoW list to arrange the different features in order to help me decide on what was the most important ones and what I did not need.

After getting a more defined vision of what the app should contain I started to create paper prototypes. First I quickly sketched the different pages of the app and then I made some more detailed screens. The app is in many ways pretty similar to other second-hand apps, but there are some features that stand out, for example the option to add children to your profile so that you can easily find shoes that matches their size and preferences.
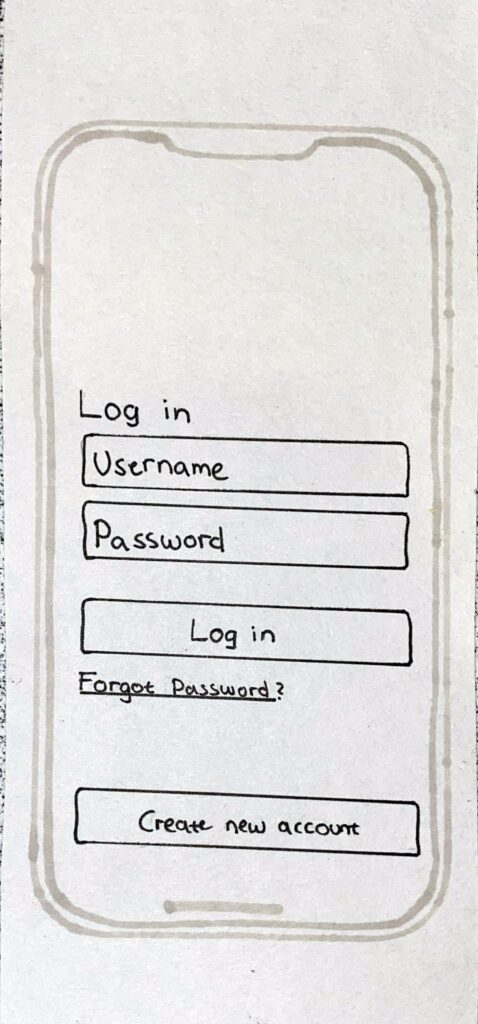
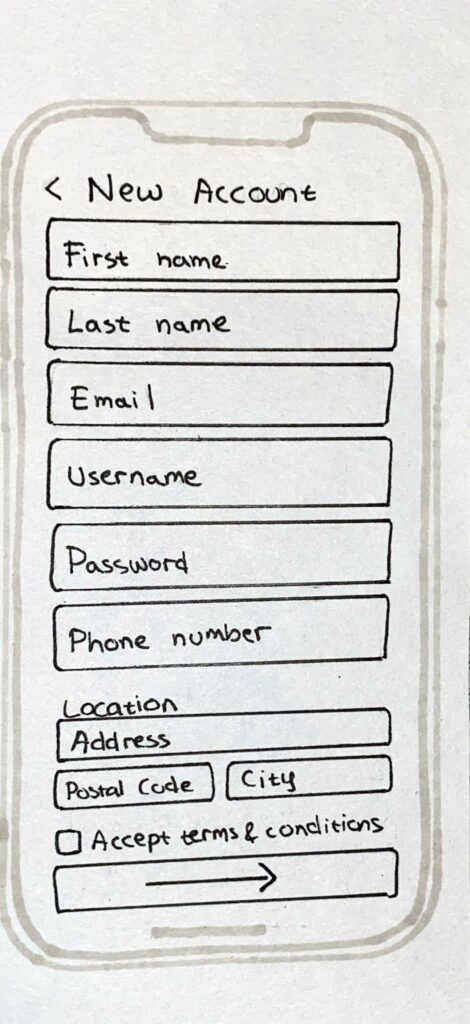
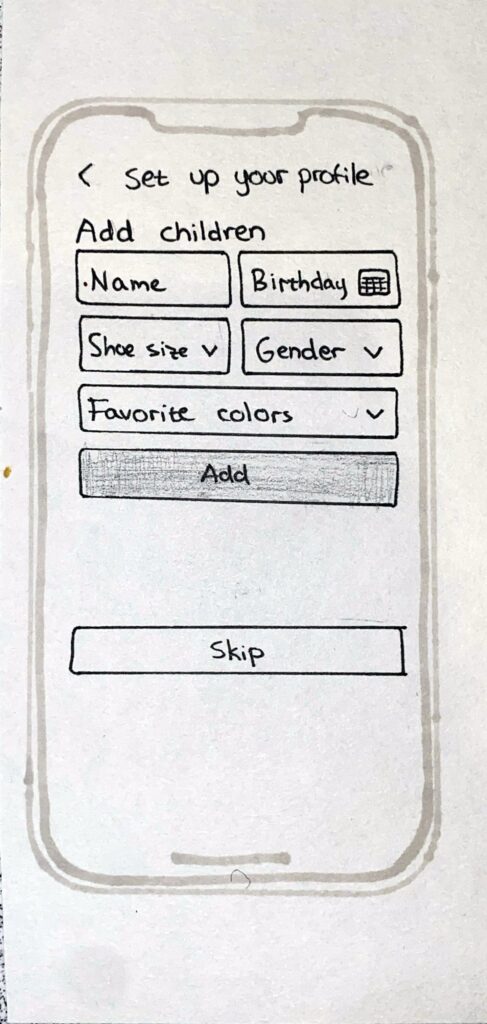
The log in page and the create new account page are pretty straight forward. When creating a new account, the information that are necessary for the app is asked from the user. The user can also add children when setting up their profile so that they can more easily find shoes for them.
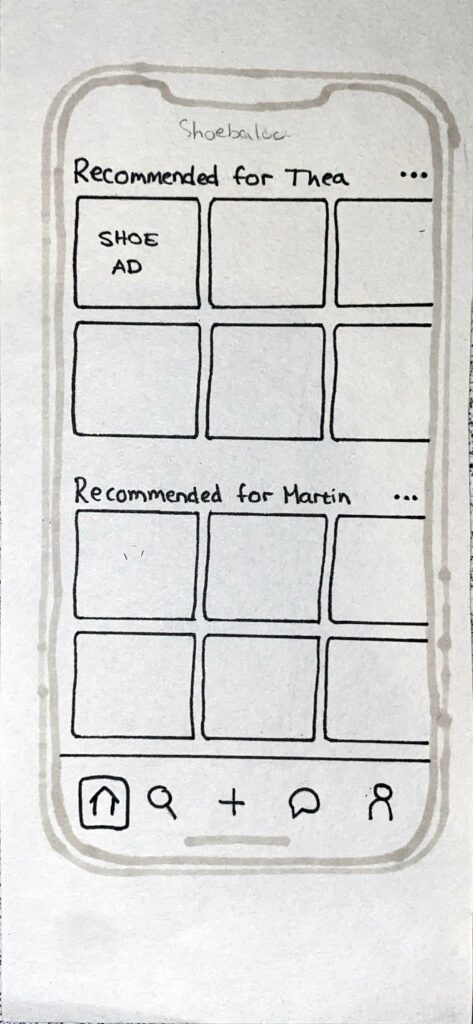
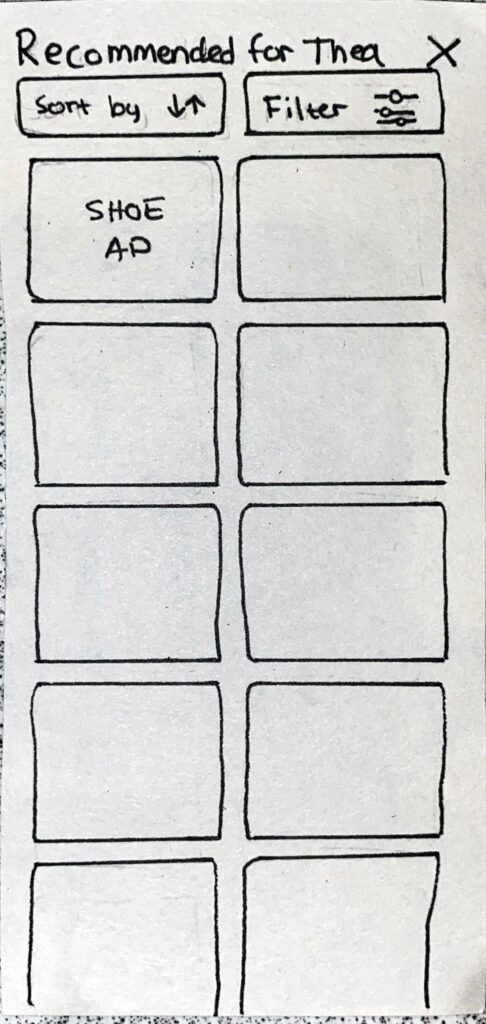
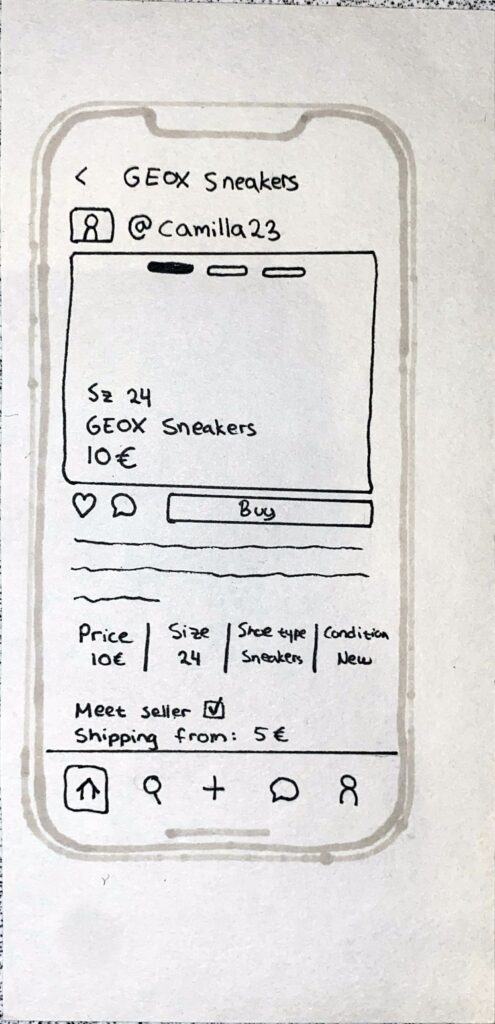
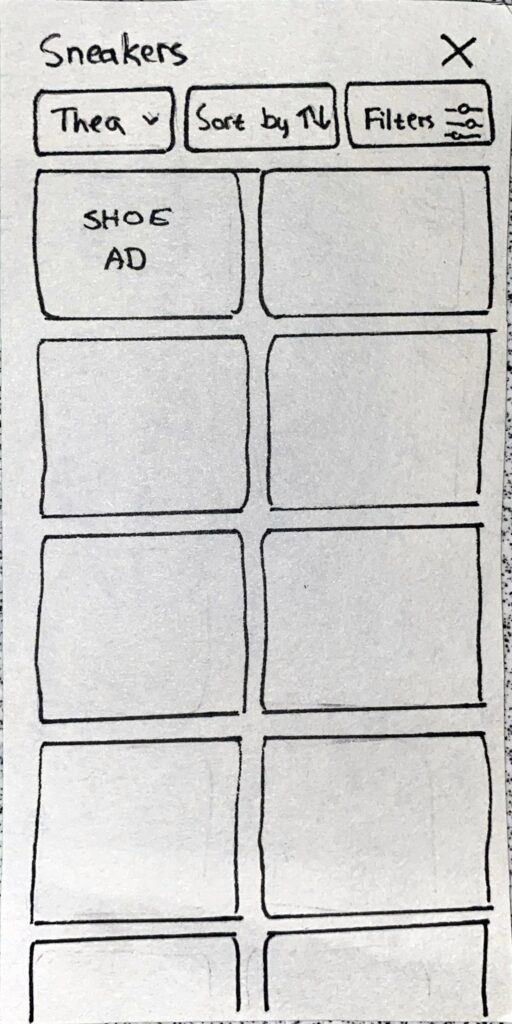
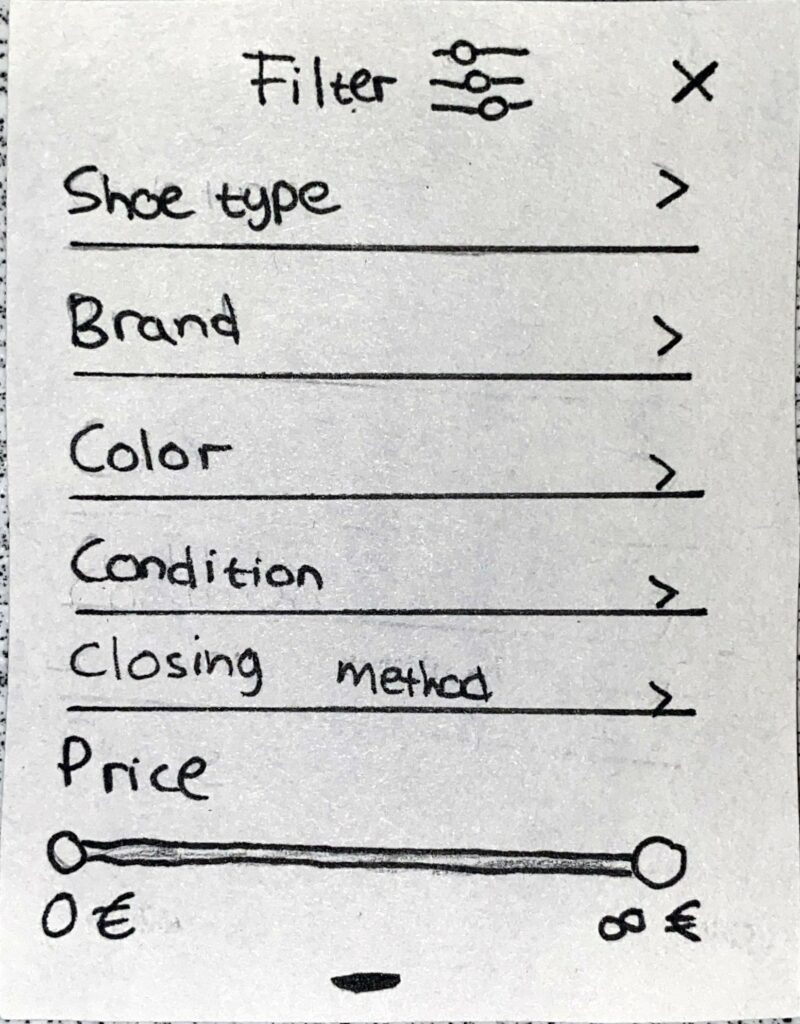
In the home page, shoes recommended for the registered children are displayed. If there are no registered children, the shoes that are displayed will either be shoes recommended based on the previous purchases or shoes that are popular in the app. It is also possible to click on recommended sections for each child in order to get a more detailed view with possibilities to sort and filter (middle picture). When an ad is clicked on, a page with more details about the shoes will be displayed (right picture).
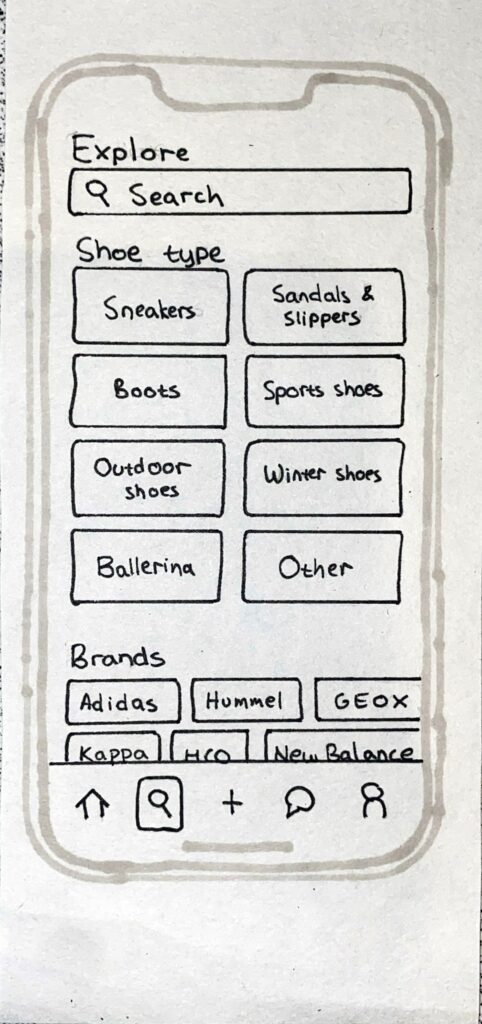
In the explore page, it is possible to search for specific tags, browse shoes based on shoe type and based on shoe brand. When browsing shoes in this section there is an additional filter option where the user can choose which child they are looking for shoes for (second picture from the left).
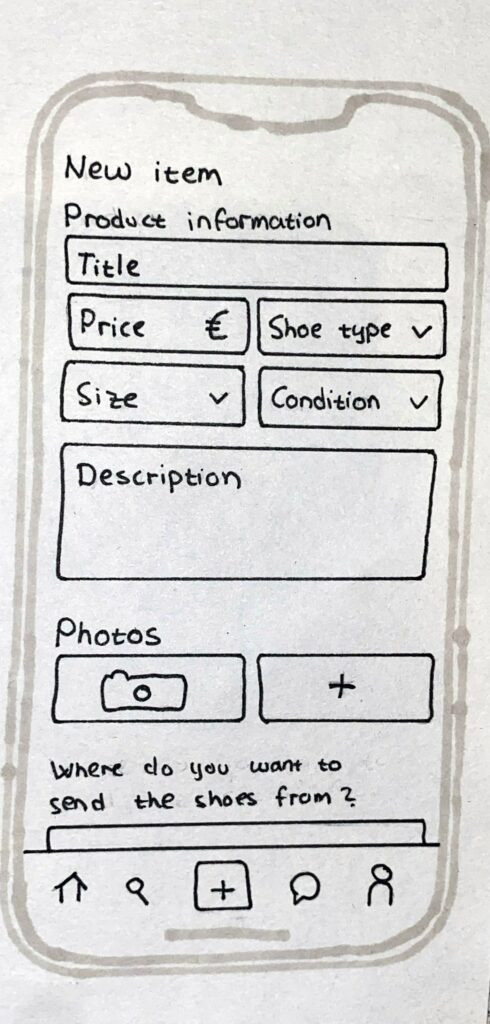
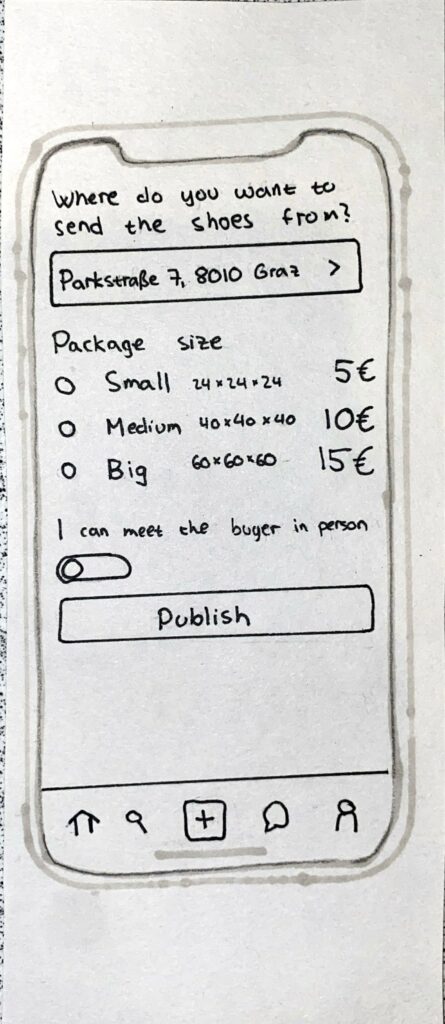
When adding a new shoe for sale, the user must fill out general information about the shoe and add pictures. The user must also decide where to send the shoes from, what package size that is correct and if they are open to meeting the buyer in person or not.
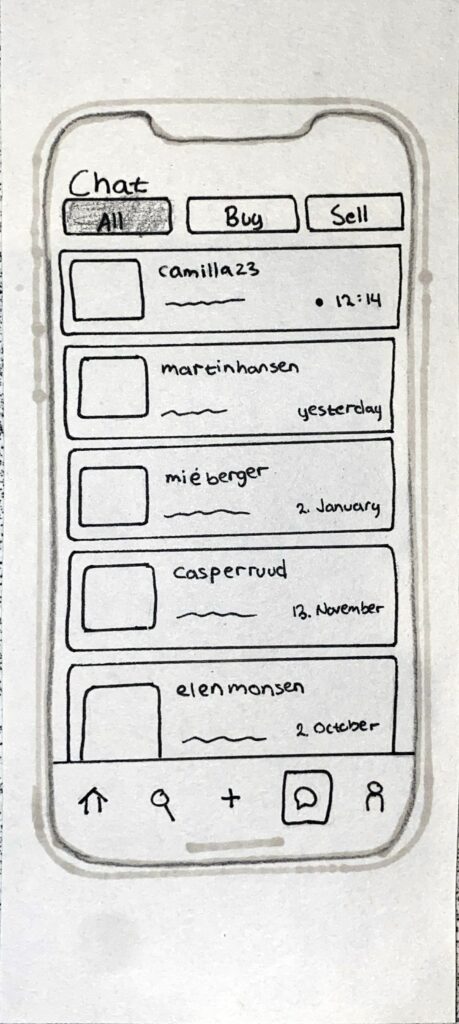
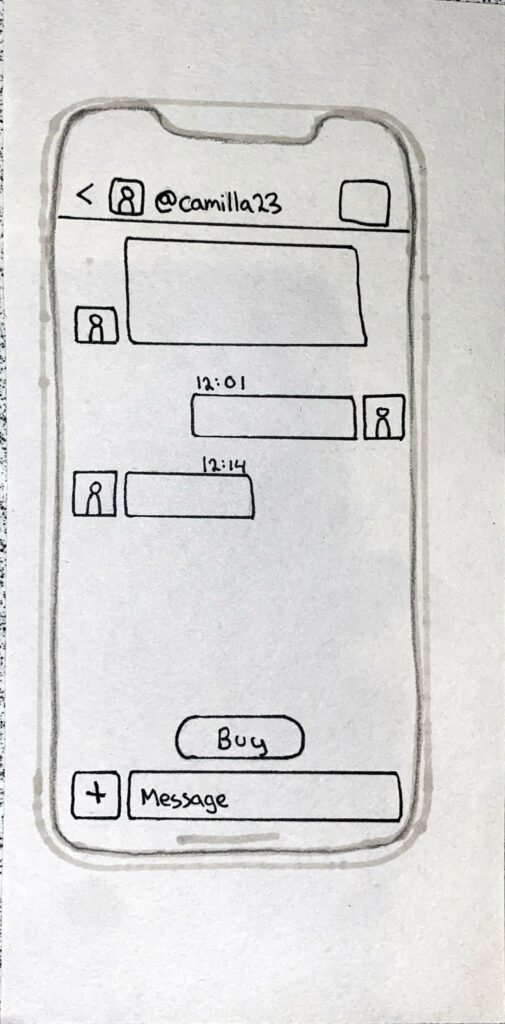
In the chat page, there is an overview of all the different chats and the user can filter the chats based on if you are buying or selling an item or both.
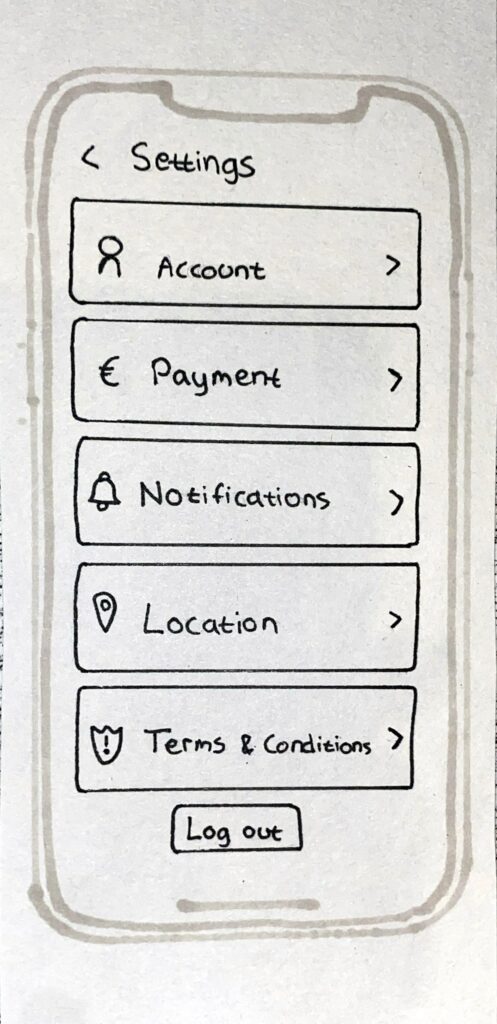
In the profile page there is an overview of the users profile, the children they have added and the shoe ads they have added, but also the shoe ads they have liked. It is possible to change the information about the children by clicking on the frame. The settings page can be reached from the profile page (icon in the upper right corner). In the settings page the user can manage their account and log out.

🩴 🥿 👠 👡 👢 👞 👟 🥾 🩴 🥿 👠 👡 👢 👞 👟 🥾 🩴 🥿 👠 👡 👢 👞 👟 🥾 🩴 🥿 👠 👡 👢 👞

Final Iterations 2

I have continued with the development of my graphics from hand drawn to to digital, and also in the process refined them and worked on making them clearer for the end-user. The final iteration of the second graphic can be seen below.

I have worked on making it a bit more organized, and also added some more information. Below you can see the previous hand drawn iteration.

The two graphics i have finished so far are mainly about tasks and workflow, but as designer we also now that our stakeholders and users are important to understand for a project to be successful. I therefore also made a graphic for who might be considered the key users in a musical festival.

This was the first hand drawn version that you could see a couple of posts ago, this is the one that was the most refined, so it is also the one with the least changes between the hand drawn and digital version.

The main differences are that the digital version is a bit “cleaner” and therefore easier to read. This one can also be viewed as an example of how it can look, but should be adapted to every unique festival. There are definitely some things that can be universal, but overall a festival should generate take these graphics and make them their own.

“Intergenerational Digital Storytelling” | 04.2

For now, my progress is small but still progress. For whatever reason, I’ve decided not to look at tutorials and instead try to figure out how to use Figma by myself. Let’s just say that I have some work done, but it is not going too fast, haha. I also found some free resources on Freepik that I downloaded (I also have the paid version) for the profile pictures. This is in case users are not comfortable putting their own picture or don’t have a picture of a family member at that moment. They can use some of the icons that will be available.

In addition, I have made the login page, password reset page, account creation page, and the first page of the dashboard.

That’s it for now, see you in the next entry 🙂

SEMESTERPROJEKT – Forward Kinetic vs. Inverse Kinetic Animation

Als Hilfestellung für die Darstellung realistischer Bewegungen in Animationen gibt es für Keyframe-Animationen einige Plugins/ Scripte. Diese Plugins beziehen sich auf zwei Animationsmöglichkeiten: der Vorwärtskinematik und die inverse Kinematik. Doch was steckt hinter den zwei Begriffen?

Begriffsherleitung

Die Lehre der Kinematik (griechisch für Bewegung) beschreibt mathematisch die Bewegung von Punkten und Körpern im Raum. Untersuchungsgegenstand ist der Verlauf einer Positionsänderung, dabei werden die Ursachen und Auswirkungen in der Beobachtungen außen vor gelassen. Aber im Bereich der Animation (vor allem 3D-Animation) ist es eine Technik, welche mithilfe von mathematischen Berechnungen das Hierarchieverhalten von Gelenken ermittelt. Ihren Ursprung hat diese Methode in der Robotik. Dort entstand diese Technik aus dem Verlangen Roboterarme in ihrer Positionierung gezielt zu bedienen. Die Grundstruktur ist eine hierarchische Kette von Gelenken. Diese Gelenke kann man mit zwei unterschiedlichen Bewegungsarten steuern:

Forward Kinematic / Vorwärtskinematik (FK): Bei dieser Art der Animation werden einzelne Gelenke oder Knochen in einer festgelegten Reihenfolge bewegt, um die gewünschte Bewegung zu erzeugen. Erklärt anhand eines Beispiels: Zuerst wird der Oberarm, dann der Unterarm und dann die Hand bewegt. Somit arbeitet man sich im Animieren VORWÄRTS von der Schulter zur Fingerspitze hin. Vorwärtskinematik ist praktisch für schwingende Bewegungen (overlapping actions). Beispielsweise sieht man bei der ersten nachfolgenden Animation die Handbewegung mit Vorwärtskinematik animiert und bei der nächsten ist die Handbewegung mit Hilfe inverser Kinematik animiert worden. Für jede der Animationen wurde die selbe Zeit für die Bewegung investiert. Deshalb sieht man klare Unterschiede: während die IK-Animation keine Kurve aufweist bzw. müsste man dafür die Pfad-Animation anpassen, passiert bei der FK-Animation die Bewegung entlang einer Kurve von alleine. Deshalb wirkt diese Animation auch harmonischer.

Inverse Kinematic / Inverse Kinematik (IK) Bei dieser Technik wird die Bewegung einer Animation eines Charakters oder Objekts durch die Steuerung eines Zielpunktes oder Endeffektors, von dem aus die Bewegung der Gelenke automatisch berechnet wird, bestimmt. Die Software berechnet die Positionen der einzelnen Teile im Zusammenhang mit der Position des Zielpunktes. Der Vorteil daran ist, dass komplexe Bewegungen einfacher zu erstellen sind. Inverse Kinematik eignet sich am besten für Laufzyklen, Springen, Fahrradfahren, Klettern und wenn es darum geht auf genaue Positionen zu animieren.

Abschließend sollte man anmerken, das inverse Kinematik nicht Vorwärtskinematik ausschließt und vice versa.

Quellen

Hagler, Jürgen (10.04.2006): Kinematik: FK / IK, http://www.dma.ufg.ac.at/app/link/Grundlagen%3A3D-Grafik/module/14174?step=all

Calm Technology // 18

With my new prototype set up, I was ready to start scripting the different gestures for Tap. I decided to make three different gestures for now: the wave, the tap and the knock. The wave for Tap to say hello or to acknowledge a new command. The tap as a way of interacting with other objects and bringing them into the user’s focus. And finally, the knock as a more analogue way of notifying the user of, for example, a timer or a specific event.

The first gesture is the wave gesture. It is intended to let the user know that Tap is active or has accepted the new command or task. In this movement, the top rotates from left to right and the tapper waves from one side to the other a few times.

Tap waving
#include <AccelStepper.h>

#define motorInterfaceType 1

// Define the stepper motor and the pins that is connected to // (STEP, DIR)
AccelStepper stepper1(motorInterfaceType, D5, D6); 
AccelStepper stepper2(motorInterfaceType, D7, D8);

// Set the target positions for both steppers
int PositionDown = 0;
int PositionUp = 0;

// State variable to keep track of movement sequence
int state1 = 0;
int state2 = 0;

////////////////////////////////////////////////////////////////////////////////////


void setup() {
  
  Serial.begin(9600);

  // Settings for Motor 1
  stepper1.setMaxSpeed(1000); 
  stepper1.setAcceleration(500);
  stepper1.setCurrentPosition(0);

  // Settings for Motor 2
  stepper2.setMaxSpeed(1000);
  stepper2.setAcceleration(500);
  stepper2.setCurrentPosition(0);

}


////////////////////////////////////////////////////////////////////////////////////


void loop() {
  
  Wave1();
  Wave2();

}


////////////////////////////////////////////////////////////////////////////////////


void Wave1() {

  switch (state1) {

    case 0:
      stepper1.setAcceleration(200);
      PositionDown = 40;
      stepper1.moveTo(PositionDown);
      state1 = 1;
      break;
    
    case 1:
      if (stepper1.distanceToGo() != 0) {
        stepper1.run();
      } else {
        stepper1.stop();
        PositionDown = -40;
        stepper1.moveTo(PositionDown);
        state1 = 2;
      }
      break;
    
    case 2:
      if (stepper1.distanceToGo() != 0) {
        stepper1.run();
      } else {
        stepper1.stop();
        PositionDown = 20;
        stepper1.moveTo(PositionDown);
        state1 = 3;
      }
      break;

    case 3:
      if (stepper1.distanceToGo() != 0) {
        stepper1.run();
      } else {
        stepper1.stop();
        PositionDown = -20;
        stepper1.moveTo(PositionDown);
        state1 = 4;
      }
      break;

    case 4:
      stepper1.setAcceleration(100);
      if (stepper1.distanceToGo() != 0) {
        stepper1.run();
      } else {
        stepper1.stop();
        PositionDown = 0;
        stepper1.moveTo(PositionDown);
        state1 = 5;
      }
      break;
    
    case 5:
      if (stepper1.distanceToGo() != 0) {
        stepper1.run();
      } else {
        stepper1.stop();
      }
      break;

  }
}


void Wave2() {

  if (state1 >= 4){

    switch (state2) {

      case 0:
        stepper2.setAcceleration(275);
        PositionUp = 25;
        stepper2.moveTo(PositionUp);
        state2 = 1;
        break;
      
      case 1:
        if (stepper2.distanceToGo() != 0) {
          stepper2.run();
        } else {
          stepper2.stop();
          PositionUp = -25;
          stepper2.moveTo(PositionUp);
          state2 = 2;
        }
        break;
      
      case 2:
        if (stepper2.distanceToGo() != 0) {
          stepper2.run();
        } else {
          stepper2.stop();
          PositionUp = 15;
          stepper2.moveTo(PositionUp);
          state2 = 3;
        }
        break;

      case 3:
        
        if (stepper2.distanceToGo() != 0) {
          stepper2.run();
        } else {
          stepper2.stop();
          PositionUp = -15;
          stepper2.moveTo(PositionUp);
          state2 = 4;
        }
        break;

      case 4:
        if (stepper2.distanceToGo() != 0) {
          stepper2.run();
        } else {
          stepper2.stop();
          PositionUp = 15;
          stepper2.moveTo(PositionUp);
          state2 = 5;
        }
        break;

      case 5:
        if (stepper2.distanceToGo() != 0) {
          stepper2.run();
        } else {
          stepper2.stop();
          PositionUp = -15;
          stepper2.moveTo(PositionUp);
          state2 = 6;
        }
        break;

      case 6:
        if (stepper2.distanceToGo() != 0) {
          stepper2.run();
        } else {
          stepper2.stop();
          PositionUp = 0;
          stepper2.moveTo(PositionUp);
          state2 = 7;
        }
        break;  
      
      case 7:
        if (stepper2.distanceToGo() != 0) {
          stepper2.run();
        } else {
          stepper2.stop();
        }
        break;

    }
  }
}

The second gesture is the tap gesture. It is intended as an object-based reminder for things like drinking water or airing out your room. It can also be used in combination with objects to create a different sound for timers and reminders than knocking on the ground. In this gesture, the tapper moves down a quarter turn and the entire base then rotates the tapper twice against the object before returning to the default position.

Tap tapping
#include <AccelStepper.h>

#define motorInterfaceType 1

// Define the stepper motor and the pins that is connected to // (STEP, DIR)
AccelStepper stepper1(motorInterfaceType, D5, D6); 
AccelStepper stepper2(motorInterfaceType, D7, D8);

// Set the target positions for both steppers
int PositionDown = 0;
int PositionUp = 0;

// State variable to keep track of movement sequence
int state1 = 0;
int state2 = 0;

////////////////////////////////////////////////////////////////////////////////////


void setup() {
  
  Serial.begin(9600);

  // Settings for Motor 1
  stepper1.setMaxSpeed(1000); 
  stepper1.setAcceleration(500);
  stepper1.setCurrentPosition(0);

  // Settings for Motor 2
  stepper2.setMaxSpeed(1000);
  stepper2.setAcceleration(500);
  stepper2.setCurrentPosition(0);

}


////////////////////////////////////////////////////////////////////////////////////


void loop() {
  
  Tap1();
  Tap2();

}


////////////////////////////////////////////////////////////////////////////////////


void Tap1() {

  if (state2 >= 2){

    switch (state1) {

      case 0:
        stepper1.setAcceleration(300);
        PositionDown = -20;
        stepper1.moveTo(PositionDown);
        state1 = 1;
        break;
        
      case 1:
        if (stepper1.distanceToGo() != 0) {
          stepper1.run();
        } else {
          stepper1.stop();
          PositionDown = 5;
          stepper1.moveTo(PositionDown);
          state1 = 2;
        }
        break;
        
      case 2:
        stepper1.setAcceleration(600);
        if (stepper1.distanceToGo() != 0) {
          stepper1.run();
        } else {
          stepper1.stop();
          PositionDown = -20;
          stepper1.moveTo(PositionDown);
          state1 = 3;
        }
        break;

      case 3:
        if (stepper1.distanceToGo() != 0) {
          stepper1.run();
        } else {
          stepper1.stop();
          PositionDown = 0;
          stepper1.moveTo(PositionDown);
          state1 = 4;
        }
        break;

      case 4:
        stepper1.setAcceleration(100);
        if (stepper1.distanceToGo() != 0) {
          stepper1.run();
        } else {
          stepper1.stop();
        }
        break;
      
    }
  }
}


void Tap2() {

  switch (state2) {

    case 0:
      stepper2.setAcceleration(400);
      PositionUp = 50;
      stepper2.moveTo(PositionUp);
      state2 = 1;
      break;
    
    case 1:
      if (stepper2.distanceToGo() != 0) {
        stepper2.run();
      } else {
        stepper2.stop();
        PositionUp = 0;
        stepper2.moveTo(PositionUp);
        state2 = 2;       
      }
      break;

    case 2:
      if (state1 >= 4) {
        stepper2.setAcceleration(200);
        if (stepper2.distanceToGo() != 0) {
          stepper2.run();
        } else {
          stepper2.stop();
        }
      }
      break;
        
  }
}

The third gesture is the knock gesture. It is intended as an analogue notification for timers, reminders or other events. In this gesture, only the tapper itself moves. It moves slightly backwards and then knocks twice on the ground before returning to its normal position.

Tap knocking
#include <AccelStepper.h>

#define motorInterfaceType 1

// Define the stepper motor and the pins that is connected to // (STEP, DIR)
AccelStepper stepper1(motorInterfaceType, D5, D6); 
AccelStepper stepper2(motorInterfaceType, D7, D8);

// Set the target positions for both steppers
int PositionDown = 0;
int PositionUp = 0;

// State variable to keep track of movement sequence
int state1 = 0;
int state2 = 0;

////////////////////////////////////////////////////////////////////////////////////


void setup() {
  
  Serial.begin(9600);

  // Settings for Motor 1
  stepper1.setMaxSpeed(1000); 
  stepper1.setAcceleration(500);
  stepper1.setCurrentPosition(0);

  // Settings for Motor 2
  stepper2.setMaxSpeed(1000);
  stepper2.setAcceleration(500);
  stepper2.setCurrentPosition(0);

}


////////////////////////////////////////////////////////////////////////////////////


void loop() {
  
  Knock1();

}


////////////////////////////////////////////////////////////////////////////////////


void Knock1() {

  switch (state1) {

    case 0:
      stepper2.setAcceleration(400);
      PositionUp = -20;
      stepper2.moveTo(PositionUp);
      state1 = 1;
      break;
    
    case 1:
      if (stepper2.distanceToGo() != 0) {
        stepper2.run();
      } else {
        stepper2.stop();
        PositionUp = 80;
        stepper2.moveTo(PositionUp);
        state1 = 2;
      }
      break;
    
    case 2:
      if (stepper2.distanceToGo() != 0) {
        stepper2.run();
      } else {
        stepper2.stop();
        PositionUp = 60;
        stepper2.moveTo(PositionUp);
        state1 = 3;
      }
      break;

    case 3:
      stepper2.setAcceleration(800);
      if (stepper2.distanceToGo() != 0) {
        stepper2.run();
      } else {
        stepper2.stop();
        PositionUp = 80;
        stepper2.moveTo(PositionUp);
        state1 = 4;
      }
      break;

    case 4:
      if (stepper2.distanceToGo() != 0) {
        stepper2.run();
      } else {
        stepper2.stop();
        PositionUp = 0;
        stepper2.moveTo(PositionUp);
        state1 = 5;
      }
      break;
    
    case 5:
      if (stepper2.distanceToGo() != 0) {
        stepper2.run();
      } else {
        stepper2.stop();
      }
      break;

  }
}


The scripting and testing of the gestures went almost smoothly with the help of ChatGPT for the coding part. Except for one problem where the lower motor started to overheat and slowly melt my 3D print. Luckily I caught it before it did any irreversible damage. The problem ended up being that I set the current flow in the motor controller for the lower motor too high, which was quickly fixed and everything went smoothly again. From here I will now start to implement all the different gestures into one script and add the functionality of triggering the different gestures via OSC messages so that I can then create a dedicated interface to control Tap.

Map Icons

Icons in general

When designing icons, start with a consistent grid to ensure alignment and visual stability. Use simple geometric shapes like circles and squares for a clean foundation. Ensure all edges, lines, corners, and curves are mathematically precise for a polished look. Maintain aesthetic unity with consistent design elements across all icons. Avoid unnecessary complexity – use details sparingly for clarity and recognition. Finally, add distinctive elements to make your icons unique and memorable. This is a short summary of what Smashing Magazine says about icon design. These principles apply to map icons as well and is a good starting point for creating my own icons.

OpenStreetMap Icons

OpenStreetMap has their own design language – it employs simple, straightforward icons that can be easily understood at a glance. They use a variety of shapes and colors to differentiate between different types of locations, such as parks, restaurants, and hospitals. There is a full list and guide on how these are implemented on the OSM Wiki.

While OSM is great for clarity, the design language of their icons and symbols feels a bit outdated compared to today’s design trends. So while it is a great resource for inspiration and checking on norms, I will design my icons differently than those from OSM.

Designing custom icons for Vanlifezone.com

Vanlifezone.com caters to people in the van life community, and the map I am building should display relevant information for this community. These will only be used for the points/nodes layer, since polygon/fill or line layers are better described with a key or accompanying text along the line or outline of the layer.

As you have seen in the previous blog post, I’ve already created a list of layers that I want to map. I searched the web for inspiration and found Apple Map’s solution for icons to be best in conveying information without convoluting the map unnecessarily. They use colored circles which enclose the symbols.

My icons were create from a mixture of custom icons (tent, wrench, storefront, key) and open source icons from tabler-icons.io. Special icons (article, warning, hotspot) are not contained in a white-bordered circle like the other icons. I wanted to differentiate these because on the one hand, they are user generated content, and on the other hand, they have higher importance on the map.

Some basic icons in action on the Vanlifezone map

Icon density, clustering, and zoom levels

Another aspect of implementing icons into the actual web map is the consideration of zoom level for displaying the icons. This is crucial, as showing the icons at a very low zoom level (map is zoomed out far) can be overwhelming for the user, browser, and data transfer bandwidth. Showing icons too late, so at a high zoom level, will not be beneficial to the user, as they would have to zoom in way too far to see relevant information for an area.

I found that a zoom level of 8.5 – 9 is a good middle ground for these two issues.

Another aspect to consider with icon placement is the icon density. If the density of icons on a map is too high, it’s good practice to implement clustering to avoid overwhelming the user. Clustering groups nearby icons together to improve readability and user experience. As the user zooms in, clusters break apart to reveal individual icons, providing more detailed information. The clusters are visualized by a bigger circle, displaying the number of clustered points of interest in the middle.

If clustering wants to be avoided, another solution is to simply not show all icons at once. In Mapbox there is a setting to not allow icon overlap, so as the user zooms in more icons will become visible when more screen real estate is available.


https://wiki.openstreetmap.org/wiki/OpenStreetMap_Carto/Symbols

https://wiki.openstreetmap.org/wiki/Map_Icons

https://www.smashingmagazine.com/2016/05/easy-steps-to-better-logo-design

Map Layers

Map layers can come in various formats, each with its own advantages and nuances:

  • GeoJSON This is a format for encoding a variety of geographic data structures. It supports point, line, and polygon geometries, making it a versatile choice for map layers.
  • KML Short for Keyhole Markup Language, KML is an XML-based format for expressing geographic annotation and visualization. It is commonly used with Google Earth and other Google tools.
  • Shapefile This format is widely used in GIS (Geographic Information System) software. It organizes geospatial data into a vector format that can be used to create map layers.
  • GML Stands for Geography Markup Language, GML is an XML-based format for encoding geographic information, including both the geometry and properties of geographic features.

Choosing the right format for the map layers depends on your specific needs and the tools one is using. For my use case, I’m focusing on GeoJSON. This format comes with good javascript and database support, which are two important factors for the map I am working on. GeoJSON can not only store the geometries of a layer, but also data relating to these layers. This can be anything, but a typical structure for an OSM location may look like this:

{
  "type": "Feature",
  "geometry": {
    "type": "Point",
    "coordinates": [16.3725, 48.208889]
  },
  "properties": {
    "name": "Stephansdom",
    "type": "cathedral",
    "amenity": "place_of_worship",
    "website": "<https://www.stephanskirche.at>",
    "osm_id": "way/17405764"
  }
}

As described earlier, map layers can generally be divided up into three different types or geometries:

  • Point A point is a geographical coordinate – a single location in a coordinate space. It is defined by a pair of coordinates (longitude and latitude). Usage of the point geometry may include representing individual locations such as specific addresses, a landmark, or a point of interest.
{
  "type": "Point",
  "coordinates": [102.0, 0.5]
}
  • Line(String) A LineString represents a series of connected points, forming a continuous line. It is defined by an array of two or more coordinate pairs. Lines can represent linear features such as roads, rivers, paths, or routes.
{
  "type": "LineString",
  "coordinates": [
    [102.0, 0.0],
    [103.0, 1.0],
    [104.0, 0.0],
    [105.0, 1.0]
  ]
}
  • Polygon A Polygon represents an area enclosed by a series of connected points, forming a closed loop. It is defined by an array of LinearRings, where the first and last coordinate pairs must be the same to close the loop. The outer LinearRing represents the boundary of the polygon, and additional LinearRings can represent holes or voids within the polygon. Polygons show areas such as country boundaries, lakes, parks, building footprints, and any other spatial areas.
{
  "type": "Polygon",
  "coordinates": [
    [
      [100.0, 0.0],
      [101.0, 0.0],
      [101.0, 1.0],
      [100.0, 1.0],
      [100.0, 0.0]
    ],
    [
      [100.2, 0.2],
      [100.8, 0.2],
      [100.8, 0.8],
      [100.2, 0.8],
      [100.2, 0.2]
    ]
  ]
}

Vanlifezone Layers

For Vanlifezone, I gathered information from other similar services, google maps, and OSM to create a list of layers that I want to include.

These layers will be sourced mainly from OSM. The next step will be to see how this data is best brought into Mapbox, while still staying editable and consumable. Mapbox already includes almost all of OSM’s data, however properties on certain nodes, such as opening hours, are not included in Mapbox’s dataset.

Mapbox Layers

Mapbox is a powerful mapping and location platform that provides developers with the tools they need to create interactive maps and incorporate them into their applications. It uses vector tiles, which are highly efficient and flexible, allowing for smooth zooming and fast loading of maps. Mapbox also offers various customization options, allowing developers to alter the style and appearance of their maps to fit their specific needs.

Mapbox provides an API that developers can use to interact with the service and include it in their applications. This API provides access to various services, including geocoding (converting addresses to geographic coordinates), directions, and more. It also allows developers to add interactive features to their maps, such as markers, popups, and user interactions (like clicking or hovering).

In the case of this blog post, Mapbox is being used to display map layers that are sourced mainly from OSM. The data from OSM is imported into Mapbox, where it can be styled and manipulated to create my desired map.

OpenStreetMap and how digital mapping works

OpenStreetMap

A significant force in the world of digital cartography is OpenStreetMap, or OSM for short. It is an open-source project focused on mapping the entire world through the collaborative efforts of volunteers using freely accessible and editable geographic data.

OpenStreetMap’s main strength is its dedication to open data. Open data means anyone can use, change, and share the geographic information in OSM for free. This has a few important impacts:

  • Accessibility: Anyone can access and use OSM data without needing to pay for expensive licenses.
  • Collaboration: The open nature of the data encourages collaboration among users, developers, and organizations.
  • Innovation: Open data encourages innovation as developers can build upon existing data to create new applications and services. (This is what I’m doing!)
OpenStreetMap website

OpenStreetMap data is used in a variety of applications, from everyday navigation to disaster response. Here are a few examples:

  • Navigation Apps: Apps like Maps.me and OsmAnd use OSM data for offline navigation.
  • Humanitarian Aid: During natural disasters, organizations like the Humanitarian OpenStreetMap Team (HOT) use OSM to provide up-to-date maps for disaster response.
  • Urban Planning: City planners and researchers use OSM data for analyzing urban development and planning new infrastructure.

How digital mapping works

Since this data is open-source and easily accessible, it is a great starting point for creating ones own maps. But digital mapping is a complex topic – more so than it may seem at first. Since it is also a broad topic, I will focus on how the rendering and viewing of digital maps works, as this relates most to my project.

Rendering in digital mapping refers to the process of generating a visual representation from a model, in this case, geographic data. In the context of OpenStreetMap, the geographic data is processed by a rendering engine to produce the final map that users see.

It starts with the raw data, which consists of points (representing locations), lines (representing roads, rivers, etc.), and polygons (representing areas such as parks, buildings, etc.). This data is usually stored in a geographic database.

The rendering engine takes this data and applies a style sheet, which defines how each type of feature (roads, parks, water, etc.) should be displayed – its color, width, pattern, and other visual attributes. This process is called “’styling”.

Next, the styled data is “drawn” onto a blank canvas to create the map. This is done in layers, with each layer representing a different type of feature. The order of the layers is important as it determines what features appear on top of others. For example, roads are typically drawn last so they appear on top of other features like parks and buildings.

Finally, the rendered map is divided into tiles, which are small, square images. These tiles are what you actually see when you look at a digital map on a screen. When you pan or zoom, different tiles are loaded in to give the impression of a seamless map.

It’s important to note that rendering is a computational heavy process, and for large maps, it can take a lot of time and resources. Therefore, tiles are usually pre-rendered and stored on a server, ready to be served up to users when needed.

Map tiles of New York From https://developers.google.com/maps/documentation/tile/

The Future of Vanlife Mapping: Trends and Predictions

Introduction

As we look towards the future of vanlife map design, we’re poised to witness significant changes influenced by technological advancements and evolving user expectations. The integration of Geographic Information System (GIS) technology with emerging trends promises to revolutionize how vanlifers interact with maps.

Emerging Trends in Vanlife Map Design

Cloud-Based GIS Solutions

Cloud technology is increasingly adopted in the GIS industry, allowing for real-time analysis, sharing, and purchasing of geodata over the internet. This shift to cloud-based systems facilitates streamlined operations and enhances real-time interaction with maps, a feature that could be incredibly beneficial for vanlifers needing up-to-date information.

3D Mapping and Digital Twins

The advancement in drone technology and LiDAR scanning is making 3D mapping more accessible and accurate. This could lead to vanlife maps offering virtual, as-built infrastructures, providing a more immersive understanding of terrains and landscapes.

Real-Time Data and IoT Integration

The growing importance of real-time data in sectors like transportation and emergency management indicates that future vanlife maps might incorporate real-time traffic updates, weather conditions, and even spot potential hazards, leveraging the Internet of Things (IoT) for comprehensive data integration.

Augmented Reality (AR) in Mapping

AR is set to provide an interactive and immersive mapping experience. For vanlifers, this could mean enhanced navigation with overlaid information about the surrounding environment, blending the physical and digital worlds seamlessly.

Automation and Machine Learning

Machine learning and automation are expected to play a crucial role in future map designs. These technologies could automate route optimization and predictions based on user behavior, making maps more intuitive and personalized for vanlifers.

Conclusion

The future of vanlife mapping is geared towards creating more dynamic, interactive, and personalized experiences. These advancements will not only enhance the practicality of maps for navigation but also enrich the overall experience of living on the road. By embracing these technological trends, vanlife maps are set to become an indispensable tool for the modern nomad.

https://www.esri.com/about/newsroom/blog/mapping-future-gis/

https://mappitall.com/blog/gis-technology-trends-that-driving-the-future

Balancing Aesthetics and Functionality in Map Design

Creating maps that are both visually appealing and functionally effective is a delicate art. This blog post examines how to achieve a balance between aesthetics and practicality in map design, ensuring that maps are not only engaging to look at but also serve their intended purpose efficiently.

Principles of Effective Visual Design in Maps

Legibility and Clarity

Legibility is paramount in map design. This involves selecting symbols that are familiar and appropriately sized to ensure that they are effortlessly seen and understood. For example, using geometric symbols for airports and more complex symbols, like a mortarboard for universities, but ensuring they are large enough to be legible.

Hierarchical Organization

Maps should visually separate information into layers, helping users focus on what is important. For reference maps, many features should lie on the same visual plane, while thematic maps should highlight the theme more than the base providing geographic context.

Balance and Composition

Balance in map design involves organizing the map and other elements on the page to create an impression of equilibrium and harmony. This can be achieved by considering visual weight and direction of the elements on the page.

Adapting to Screen Sizes

In the digital age, maps must be designed to work across different devices. For mobile devices, prioritize essential functions and streamline controls for touch, while on desktops, offer detailed controls and capitalize on hover interactions.

Enhancing User Experience Without Compromising Usability

Responsive Design

Responsive design ensures maps look great and function seamlessly across all platforms, especially important given the increasing use of mobile devices. Simplifying design for smaller screens and using larger buttons can facilitate user interaction.

UX Principles in Map Design

Clear, instinctive navigation and alleviating load times are crucial. Optimizing site speed through image compression and code minification can maintain aesthetic appeal while ensuring a seamless user experience.

The Role of Aesthetics in User Engagement

Aesthetics influence user behavior and perceptions significantly. People form opinions of a website within milliseconds, making first impressions crucial. Paying attention to elements like white space and using high-quality images and illustrations can greatly enhance user engagement.

Conclusion

Balancing aesthetics with functionality in map design is crucial for creating maps that not only attract users but also provide a seamless and efficient navigational experience. By adhering to principles of legibility, hierarchical organization, balance, responsive design, and incorporating user experience elements, designers can create maps that are both beautiful and useful.

https://www.uxpin.com/studio/blog/map-ui/

https://www.esri.com/news/arcuser/0112/make-maps-people-want-to-look-at.html