In my last blog entry, I experimented with whether the vibration of the larynx alone could be used to read the pitch. Since this worked and I know that this technique is the basis for the concept, I have continued to work on the visualisation.
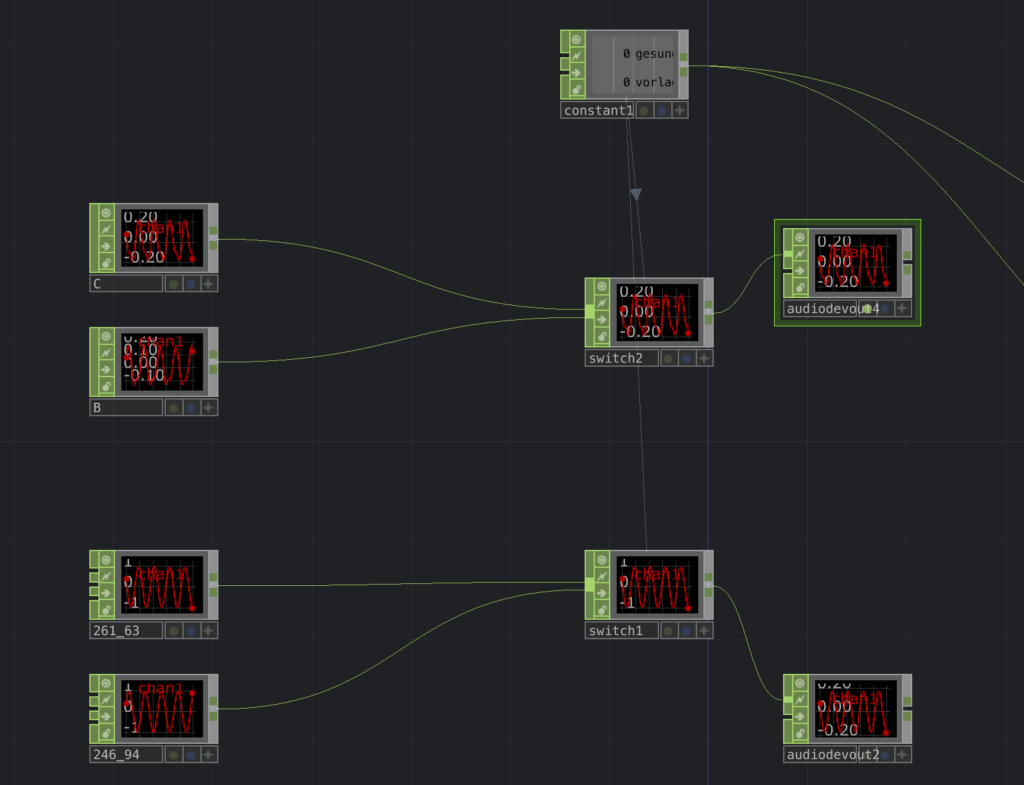
For my prototype I used Touchdesigner to compare my singing with the pure tone frequency and to see whether the information from the tuner was correct. As a result, you could hear that it worked.

The next step was to build a 3D model that visually represents my prototype. Part one is a small device that is placed close to the larynx to measure the vibration frequency. The analysed frequency is transferred to either a wristband or a clipper on the notebook and tells you if you have sung too high or too low.
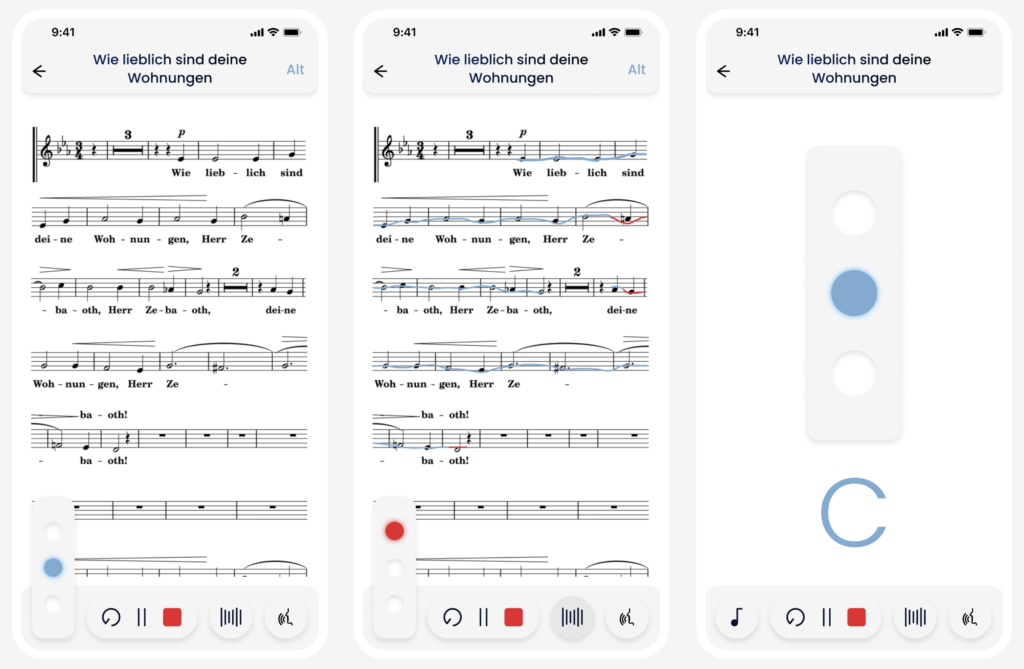
With a simple interactive visualisation I show how the whole thing could work. The sung note is first compared with the pure frequency. If both match, the blue light in the centre lights up and if, as in my recording, the pitch was too low, the lower sphere lights up red. If the pitch is too high, the upper light lights up red.
The final part of my prototype is an app prototype with the idea to upload the choir score digitally qnd connect it to the vibration sensor. The sung notes are compared with the sheet music, and any inaccuracies are highlighted with a blue or red line, indicating where you are in the song and whether the pitch and timing are correct. I aim to keep the visualisation in the app simple, yet professional enough to provide a detailed vocal analysis.

Problem
One problem I had was reaching my choirmaster. Since I couldn’t go to rehearsals after the test and didn’t receive any feedback on my emails, I unfortunately couldn’t get any deeper insights to be able to use them in time to push the prototype forward.