🟦 04_Visualization Samples

After creating my first visual, I wanted to experiment more with TouchDesigner and come up with different visuals.

Mirror Effect on the First Visual

First, I changed the initial visual by applying a mirror effect. I aimed to create clear lines that resemble an audio wave. I liked that it looks like a mouth, and I am happy with the result. However, I wanted to try more variations.

Second Visual with Particles

For the second visual, I followed a tutorial on working with particles. While I enjoyed this process, the result felt too random for my project. I realized that I need more control over the particle movements to fit my theme better.

Mirror Effect on the Second Visual

Lastly, I mirrored the second visual. This resulted in too many mirrored sections and small particles. Despite this, I loved the outcomes and really enjoyed experimenting with TouchDesigner.

Next Step

In next step, I plan to make all of these visuals audio-reactive and then choose the one that fits my project best. I am having a lot of fun experimenting with TouchDesigner, I love itttt!

09 – “Story Teller” – Prototype Development

Introduction

After conducting a thorough analysis of different research papers and exploring various existing authoring tools, I embarked on the journey of developing my own prototype. This process involved the examination of the strengths and weaknesses of each tool, as well as an in-depth understanding of the theories and methodologies presented in each research paper. With this knowledge, I then proceeded to apply what I had learned to the creation of my prototype. The objective of this blogpost is to document the process that I underwent during the prototyping phase.

Methodology

I began by listing all the sections I wanted to reimplement from StoryTec, including the G-Flash card system and Story Curve Visualization mode.

  • Story Editor: This is a free canvas where users can drag, resize, move, and zoom in and out of elements.
    • Scenes: These contain characters, interactive elements, and behaviors such as actions, dialogue, and events.
    • Complex Scenes (which I’ll refer to as Stages): These are the environments where scenes take place. They contain stage-specific elements and, of course, the scenes themselves.
  • Stage Editor: In StoryTec, this was a pluggable framework capable of constructing scenes in various ways. For ease of use, I will integrate this as a function of the Story Editor, utilizing a toolbar with drag-and-drop flashcards, similar to G-Flash. In my version, the cards will be fully customizable through the Property Editor.
  • Property Editor: This is a separate tab that adapts based on the selected item. It can add any kind of property to any element.
  • Action Set Editor: In StoryTec, this was a separate editor for setting the logic between element interactions. In my prototype, it will become a button in the Tool tab, connecting elements similarly to how Figma handles prototyping.
  • Asset Manager: A separate tab where uploaded assets can be dragged and dropped either onto the open canvas as images, videos, or sound, or onto elements as properties.
  • Story Curve Visualization: This is an option in the top bar that changes how the scenes are displayed, toggling from the free canvas to a double-axis view of the Story Curve.

After identifying the core features and buttons for my tool, I sketched a basic information architecture on paper. Following this, I created preliminary wireframes to visualize the page’s layout.

Pages, tabs and cards

Starting from the sketches, I prototyped a low-fidelity version of the main pages for my authoring tool.

The home page displays all the stories that a user might want to create, presented in a straightforward gallery.

Each Story file features an „infinite“ zoom canvas where elements, cards, and assets can be dragged and dropped, resized, opened, and minimized. This design maximizes flexibility of thought.

When an element is clicked, the Properties tab displays all details of that specific instance, and allows the creation of new properties if necessary. These properties can be used and referenced as logic variables when establishing connections between elements.

The Stage button in the Bottom Tool Bar offers two main interactions: the New Stage card and the Element card. Both can be dragged onto the canvas and resized to create the desired composition.

Similarly, the Scene button in the Bottom Tool Bar enables the user to draw a new scene or select one of the cards for characters, elements, or behaviors.

Finally, the Story Curve View visualizes different scenes on the Narration order/Story order axis. You can personalize this visualization using the settings tab.

Goals & Conclusion

The main goal of this prototype is to thoroughly test the usability of various complex features, particularly for beginners and new storytellers. I aim to conduct an extensive user test to gain insights into whether the basic principles of User Experience (UX) are being followed and function as intended.

After initial testing and result analysis, I’ll create a higher fidelity prototype. This version will focus more on the user interface, using feedback from the initial tests to ensure a smoother, more intuitive user experience.

In my next blog post, I’ll show the main features of this prototype through a detailed demo video. This will help me show the tool’s functionality and potential.

08 – Trevor Paglen’s “Cyclops” – A complex ARG for a complex storytelling

Introduction

In the realm of digital storytelling, few experiences are as intricate and immersive as „Cyclops,“ an alternative reality game crafted by artist Trevor Paglen. „Cyclops“ serves as a masterclass in nonlinear, interactive narrative, demanding a blend of diverse knowledge areas from its players. This makes it an ideal case study for my authoring tool, which is designed to enable the creation of complex, multifaceted stories that engage audiences in unique and profound ways. Through this blog post, I want to explore how „Cyclops“, with its sophisticated storytelling structure, perfectly aligns with the capabilities of a robust authoring tool.

Summary

„Cyclops“ is an intricate and intimidating alternative reality game designed by artist Trevor Paglen. It features a basic black-and-white digital interface reminiscent of 1970s computer systems and demands extensive knowledge in fields like cryptography, vintage computers, logic, music, and PSYOPS history. Launched at the 2023 Chaos Communication Congress, it required 700 professional hackers three days to reach just the fourth level. Since then, a dedicated group on Discord has continued to collaborate, achieving 53% completion of level three. The game immerses players in complex puzzles and psychological challenges, often guided by Eliza, a reference to the first chatbot, enhancing the sense of psychological warfare.

Paglen’s goal was to create a public art project native to the online world, fostering a community united by shared interests in digital security and coded messages. Cyclops prompts players to reflect on their relationship with digital media and social interactions, blurring the lines between gaming and psychological manipulation. Paglen and his team of experts spent a year developing this intricate digital landscape, which echoes the haunting possibility that today’s internet might be an extension of historical psychological control programs like MK Ultra.

My Conclusions

The main reasons why “Cyclops” is a suited as a case study for my project are:

  • Its Complex Narrative Structure: „Cyclops“ features a nonlinear storyline that challenges players to navigate through cryptographic puzzles, vintage computer systems, and psychological tests. This complexity requires an authoring tool that can handle multiple narrative branches and interconnected storylines seamlessly.
  • Interactive and Immersive Elements: The game’s integration of various media forms, such as audio tracks, ASCII scripts, and visual puzzles, demonstrates the need for an authoring tool capable of embedding diverse interactive elements that enhance user engagement.
  • Collaborative Problem-Solving: „Cyclops“ necessitates collective intelligence and collaboration, which can be facilitated by an authoring tool that supports multi-user interaction and real-time collaboration features. This feature would go outside of the pure realm of an authoring tool for storytellers but could be an interesting future feature to give the player of any ARG a platform where they are able to collaborate, solve and piece together the story that the artist is trying to convey.

References

https://donotresearch.substack.com/p/artist-profile-trevor-paglens-cyclops

07 – Authoring Tools for Storytelling – G-Flash, StoryTec & Story Explorer

Introduction

In my research for case studies on tools for storytelling I’ve read and analysed the two following papers, „G-Flash: A Simple, Graphical Authoring Environment for Interactive Non-Linear Stories“ and „StoryTec: A Digital Storytelling Platform for the Authoring and Experiencing of Interactive and Non-linear Stories“. They provide insightful perspectives on authoring tools designed for different user groups. These tools vary significantly in complexity and user experience, offering valuable insights for developing a prototype authoring tool for interactive, non-linear storytelling. My goal is to gather the insights from these research papers and use them to design my prototype. Furthermore, I will use insights from the research paper “Visualising Nonlinear Narratives with Story Curves”, already discussed in the previous blogpost, to have in mind clear UX goals for my prototype.

Summary

G-Flash and StoryTec are both digital storytelling platforms designed to support the creation of interactive and non-linear stories, but they differ in their specific features and approaches.

G-Flash, as described by Jumail et al. in 2011, focuses on providing guided learning and assistance to young children in creating digital stories using flashcards as the main media element. It emphasizes the tutored approach to guided learning, allowing students to receive the right amount of assistance without compromising their creativity and motivation. The system architecture of G-Flash is Flash-based and web-based, with a focus on using illustrated flashcards to guide story creation.

On the other hand, StoryTec, as introduced by Göbel et al. in 2018, is a digital storytelling platform that enables the authoring and experiencing of interactive and non-linear stories. It provides an authoring environment with different editors for creating and manipulating story units, as well as a runtime engine for controlling interactive scenarios during runtime. StoryTec also includes a Story Editor for managing story structures and an Action Set Editor for defining transitions among scenes..

In summary, G-Flash focuses on providing guided learning and assistance to young children using flashcards, while StoryTec is designed to enable the creation and visualization of interactive and non-linear stories through its authoring environment and runtime engine.

Both platforms aim to facilitate the creation of digital stories, but G-Flash emphasizes guided learning for children, while StoryTec provides a comprehensive authoring framework for interactive and non-linear narratives.

My conclusions

From G-Flash, I could incorporate the concept of guided learning and assistance giving within the digital storytelling application to help beginner creative writers. This can be achieved by providing a tutored approach and using flashcards-like visuals as a media element to guide story creation. According to the study, the use of illustrated flashcards motivates children and helps them recall their experiences; this can be a valuable feature to include in my authoring tool to improve recall of more complex events in a non-linear story.

From StoryTec, I can take the focus on a user-friendly and intuitive graphical user interface (GUI) for the authoring environment to help beginner creative writers without programming skills to create interactive stories. Additionally, the separation of story structure and story content in StoryTec can be a valuable insight to consider when developing your authoring tool, as it allows for flexibility in creating and playing different story elements based on the same structure. A runtime engine for the interactive storytelling platform would be interesting to implement but requires more research.

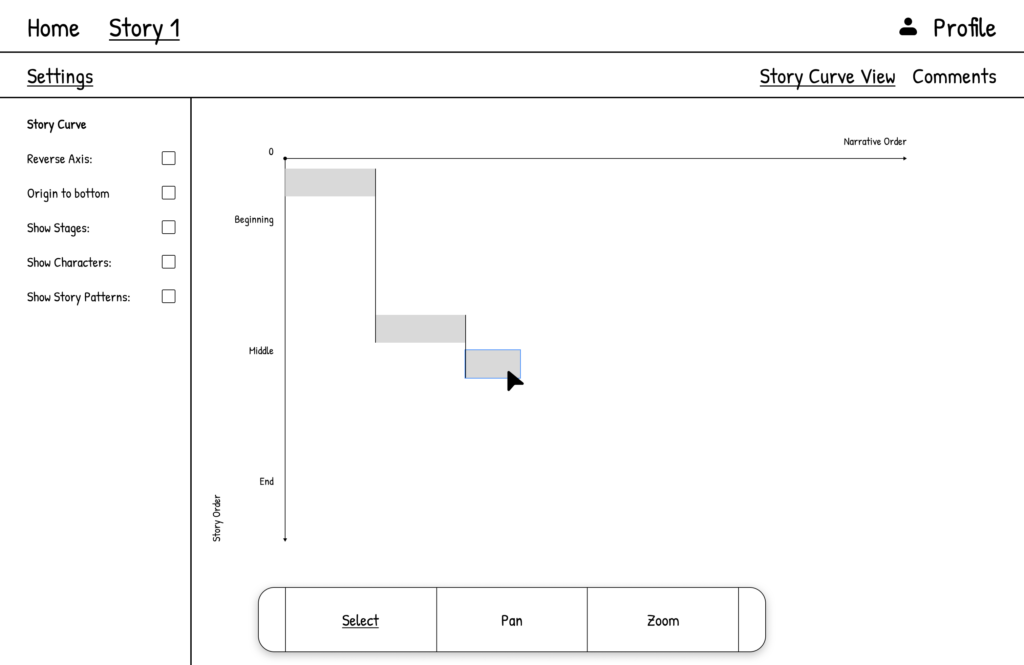
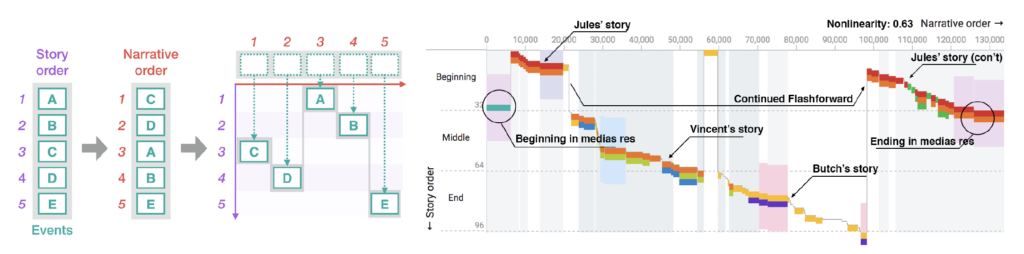
To enhance the user experience, I want to incorporate the visualization technique of Story Curves, [Blogpost 6] to reveal nonlinear narrative patterns and provide a helpful overview of the story structure. This visualization method can be used to help beginner creative writers understand the nonlinear narrative patterns in their stories and provide a visual representation of the story’s structure. I am going to take in consideration UX issues discussed in the Story Curve paper regarding the Story Explorer tool:

  1. Readability and Learnability: The evaluation of Story Explorer highlighted that some participants had difficulty in reading both story and narrative order at the same time. This suggests that providing a clear distinction between different narrative orders and visual aids for reading two axes could be useful for reading story curves.
  2. Control of Origin and Time Jumps: Participants in the evaluation study of Story Explorer struggled with the initial disorientation caused by the placement of the origin at the upper left corner and confusion between flashforwards and flashbacks. The analysis suggested that providing control of the origin of the axes and visual aids for time jumps could improve user experience.
  3. Scalability and Clean Visualization: Story Explorer integrated mechanisms to ensure a clean and scalable visualization, even for stories with hundreds of scenes. The semantic zoom feature with different representations for story elements was identified as a key factor in preventing clutter in the story graph representation.

In conclusion, by combining the insights from G-Flash, StoryTec and Story Explorer I can develop an authoring tool that provides guided learning, assistance giving, and a user-friendly interface for creating interactive, non-linear stories using the Story Curves visualization Method.

References

  1. Jumail, D. R. A. Rambli and S. Sulaiman, „G-Flash: An authoring tool for guided digital storytelling,“ 2011 IEEE Symposium on Computers & Informatics, Kuala Lumpur, Malaysia, 2011, pp. 396-401, doi: 10.1109/ISCI.2011.5958948.
  2. S. Göbel, L. Salvatore and R. Konrad, „StoryTec: A Digital Storytelling Platform for the Authoring and Experiencing of Interactive and Non-Linear Stories,“ 2008 International Conference on Automated Solutions for Cross Media Content and Multi-Channel Distribution, Florence, Italy, 2008, pp. 103-110, doi: 10.1109/AXMEDIS.2008.45.
  3. N. W. Kim, B. Bach, H. Im, S. Schriber, M. Gross and H. Pfister, „Visualizing Nonlinear Narratives with Story Curves,“ in IEEE Transactions on Visualization and Computer Graphics, vol. 24, no. 1, pp. 595-604, Jan. 2018, doi: 10.1109/TVCG.2017.2744118.

06 – Visualizing Nonlinear Narratives with Story Curves

Introduction

In the realm of digital storytelling, presenting nonlinear narratives can be particularly challenging due to their complex structures and the intricacies involved in their visualization. The paper „Visualizing Nonlinear Narratives with Story Curves“ introduces an innovative approach to tackling this issue through the development of story curves and the Story Explorer tool. As I move on into the creation of my prototype, the insights from this paper will be instrumental in shaping the way I visualize and manage nonlinear narratives. By integrating story curves into my prototype, I aim to enhance the user’s understanding and interaction with complex storylines, providing a more intuitive and engaging experience.

Summary

The paper introduces story curves, a visualization technique designed to reveal patterns in nonlinear narratives by mapping events in a two-dimensional plot based on their chronological and narrative order. The core component of this system is the Story Explorer, an interactive tool that allows users to curate and explore the chronological sequence of scenes in a movie script. The Story Explorer parses scripts to extract scenes, characters, and metadata, presenting them alongside the story curves for a comprehensive view of the narrative structure.

A schematic diagram showing how to construct a story curve from a sequence of events in story and narrative order (left). An example of a story curve of the movie Pulp Fiction (right) showing characters (colored segments), location (colored bands), and day-time (gray backdrop). A nonlinearity index is calculated based on the degree of deviation of narrative order from actual story order.

User tests were conducted to evaluate the readability and learnability of story curves. Participants were asked to answer questions regarding pattern recognition within the story curves, and the results indicated a generally high level of comprehension, with an average correctness rate of 80%. The tests highlighted some challenges, such as the simultaneous interpretation of both story and narrative orders, but overall demonstrated the effectiveness of story curves in conveying complex narrative patterns.

The goals of these tests were to assess the practicality of story curves in real-world applications and to identify areas for improvement. The results showed that story curves are a valuable tool for screenplay analysis, education, and film production, offering new perspectives on narrative structures that were previously difficult to visualize. The feedback from professional writers and scholars further emphasized the potential of story curves to revolutionize the way nonlinear narratives are understood and created.

My conclusions

Story Curves are a type of narrative visualization that is able to help both novice and experienced storytellers build a coherent non-linear narrative in, potentially, any kind media of their choice (ARG, video, web, installation, etc.).

With an improved version of Story Explorer new narrative patterns could arise due to new variables, such as media and readers interaction with the story. Adding new feature related to the challenges of multiple media and community creation would be a very interesting topic to explore and could be the ground for my digital prototype.

References

N. W. Kim, B. Bach, H. Im, S. Schriber, M. Gross and H. Pfister, „Visualizing Nonlinear Narratives with Story Curves,“ in IEEE Transactions on Visualization and Computer Graphics, vol. 24, no. 1, pp. 595-604, Jan. 2018, doi: 10.1109/TVCG.2017.2744118.

“Intergenerational Digital Storytelling” | 08.2 

Okay, I’ve decided that I’m done with my prototype. I’ve added the ‚Add Sibling‘ section, a questionnaire for that page, and how the Dashboard would look when you save those changes. I also created the possible ‚Add Grandparents‘ sections. Now, I’ll give it to some friends and colleagues to get their feedback. The next entry will most likely be about their feedback.

I am also looking forward to your feedback and I hope you don’t mind me having a more open approach with these blogs.

“Intergenerational Digital Storytelling” | 06.2

I did the best I could for the dropdown menus for now. You can see the options that the dropdown menus have, but you can’t choose any of the given options yet—I still need to figure out how to do that on my own, of course, because I still refuse to watch any tutorials. Don’t ask me why; I obviously don’t like myself, haha. 🥲

I don’t think I’m finished with this part and the options within the dropdown menus because I think there will be more follow-up questions depending on what option you choose within the dropdown menu—if that makes sense? I hope it does. Before I went too far down the rabbit hole, I remembered that this is supposed to be my *first prototype*, so honestly, what I have from the options is just enough for now. At least for me.

Next, I’ll work on the ‚My Profile‘ section, and maybe ‚Add a Sibling‘ and ‚Add a Grandparent.‘ We’ll see where the night takes us!

‚Till next entry, poyi!

“Intergenerational Digital Storytelling” | 05.2

I did a few more pages, and maybe like 17 more pages for the drop-down menus. You know how I said that I’m figuring out Figma on my own? Well, let’s just say that Figma really isn’t my friend. After doing all that, I decided I didn’t like any of it, so I deleted it all, lol. When I say that Figma is not being my friend, I mean it—Figma 👏 is 👏 not 👏 my 👏 friend!

Anyways, enough with the negativity. I took a new approach and made a page with a questionnaire to fill out when adding a parent. That type of questionnaire will be present for all family members that you would like to add. Of course, they won’t all be the same, though some questions might be repeated. In addition to this page, I created another one with some additional questions for when a certain family member is, unfortunately, no longer alive.

I will continue with making drop-down menus for these pages. After I’m done with that, I will add the ‚My Profile‘ section as well as the sections for adding siblings and grandparents.

‚Till next entry, bye!

“Intergenerational Digital Storytelling” | 04.2

For now, my progress is small but still progress. For whatever reason, I’ve decided not to look at tutorials and instead try to figure out how to use Figma by myself. Let’s just say that I have some work done, but it is not going too fast, haha. I also found some free resources on Freepik that I downloaded (I also have the paid version) for the profile pictures. This is in case users are not comfortable putting their own picture or don’t have a picture of a family member at that moment. They can use some of the icons that will be available.

In addition, I have made the login page, password reset page, account creation page, and the first page of the dashboard.

That’s it for now, see you in the next entry 🙂