„Body and Violin Fusion“ – Latest Compositional Concept IX

The piece is based on both the played and recorded materials. While it holds an overall concept, it is not a traditional written score but rather, it depends heavily on and is closely connected to the processed sounds and the programming aspect. The core idea of the piece revolves around the transition from the acoustic sound of the violin to processed and electronic sounds. This transition reflects with my own musical journey, from a classical violinist to an electroacoustic musician. Although the piece is not fully improvised, it still allows for a sense of freedom, enabling the performer to interact with the processed sounds, which vary each time during the performance. The structure of the piece is sectional, and with each step, it shifts further into the electronic domain. The starting point of that is a loop of each buffer, where the sounds are heard not being played in real-time by the performer.

Pieces like Suspensions by Atau Tanaka[1] and Weapon of Choice by Alexander Schubert[2] and also the book of Marije Baalman Composing Interactions[3], played a significant role in shaping the artistic direction of this set up. They helped me establish a connection between the technical and artistic aspects of the it, and to blend improvisation with electronic manipulation in a meaningful way.

My intention was to unify the entire piece, where in addition to the processed sound, the performer also plays live. This way, the piece does not entirely become electronic, instead it creates a polyphonic sound where different materials blend into each other. I also aimed to incorporate extended techniques on the violin, such as bowing on the body of the instrument, to capture the texture of the wood’s sound, among others. These techniques create variations with each performance attempt.

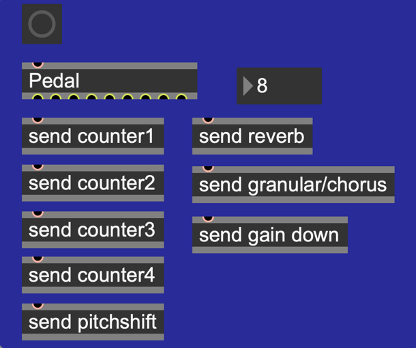
Since there is no fixed score for the piece, the timing is inherently variable. It depends not only on the recorded materials but also on the length and nature of the interactions between the performer and the electronic sounds. The performer’s engagement with the processed sounds can fluctuate, leading to different pacing and moments of intensity. Although that there is more or less clear that the most intense or the chaotic part is the moment that granular patches arise.

Towards the end of the piece I considered two possible approaches, both of which could be easily implemented within the patch. The first scenario involved abruptly cutting off the sound while the piece remained in its chaotic phase, with the violin accompanying this sudden act. The second scenario entailed first progressively increasing in intensity and then gradually fading out, so this version has a more gradual transition. These two variations could significantly alter the conceptual framework of the piece as well, either aligning with my intention to conclude with a sense of resolution or opening the door to further exploration and discovery. For now, I have chosen to conclude the piece by gradually reducing its dynamic intensity and stabilizing the sound. However this decision is not necessarily final, as the compositional process remains open to further refinement.

„Body and Violin Fusion“ – Wekinator VIII

As a result, the data values became irregular and began with a range of negative values. The attempt to provide more history to the All continues type was unsuccessful, as there were even more fluctuations in the outputs, and I couldn’t really relate to these outputs in terms of using them for an interaction.

So in conclusion I primarily used real sensor data with some scaling and processing, as the changes were smoother. This approach was suitable because, for the parts of the composition that required continuous data control, no complex gestures were involved. So I have used simple x, y, and z values, which provided sufficient accuracy and responsiveness.

Another approach was to remove the 3x rotation and total acceleration from the sensor data during the training phase to simplify the inputs for Wekinator. This was done to ensure that only the necessary data was provided, potentially making it easier for Wekinator to build a model and would result in a more efficient training. This plan proved successful, as it led to clearer outputs, which for now I have continued with this setup, using only the 3x acceleration data as the input for training Wekinator models.

The last effort in providing better data input to Wekinator was firstly to send constant data values by using the [metro] object to repeatedly trigger sensor readings at a fixed interval. If the system stops receiving data when the sensor is not moving, even for a few milliseconds, it might interpret this as a loss of connection or a gap in data, potentially leading to misinterpretations. Secondly, I tried recording some examples in Wekinator without moving my hand (just keeping it still and then pressing the record button) while maintaining a position aligned with the initial movement. I also tried to record values that were not too low in terms of speed because, as seen in the data display, low values are mostly noise and not very useful as the higher acceleration values which have a greater impact. In practice, there was a slight improvement in sensor functionality, though not significantly noticeable. But I decided to stick with this configuration, as theoretically it ensures a more stable and reliable data flow, although there should be a balance for recording more aggressive and faster movements, it also needs to align with the tempo and the overall aesthetic concept of the performance.

It is also worth mentioning that there is the possibility for experimentation with the settings of the Wekinator itself and changing the routing matrix, such as the input/output connection editor, which helped me in the early stages but not in the final one. And also WekiInputHelper, a software component that helps manage data from a feature extractor (the part that collects data), sits between Max MSP and Wekinator. It has features such as calculating the minimum, maximum, average, or standard deviation of data over time, collecting and storing data in a memory buffer, calculating changes in data (like the difference from the previous value), performing custom math, applying filters, and controlling how often data is sent or sending data only when certain conditions are met.

„Body and Violin Fusion“ – Wekinator VII

After establishing the connection between the two software programs, an effort was made to understand Wekinator’s three output types in relation to the composition concept and their application within the patches.

All classifiers or classification outputs represent distinct categories such as Position 1, Position 2 and Position 3. It is necessary to specify to Wekinator how many categories to use. Wekinator outputs numbers, such as 1, 2 or 3, corresponding to categories 1, 2, 3. It attempts to categorize each new input provided.

All continuous outputs generate numeric values within a defined range, divided into two types: Real-valued, for example to control smooth changes like any sliders, and Integer-valued, to adjust parameters such as filter cutoff frequency with an integer output.

The third type in Wekinator is Dynamic Time Warping (DTW), which is used to recognize and compare more complex patterns over time. Wekinator sends different output messages for different output types, for instance when it builds numeric or classification models, it computes a set of output values every time it sees a new input, but when Wekinator builds a dynamic time warping model, it continually looks at the input (despite the speed and the duration of them) to see how closely the current shape of the input, matches each of the example shapes or the trained patterns, this means that the random movements will provide no inputs from the Wekinator.

Figure 1. An overview of Wekinator Types in the Software

In my initial attempts, I tried to record multiple examples for each motion and map the DTW to turn on/off different gates and trigger some selected parameters once during the piece. However, after numerous trials it became clear to me that the absolute value of the DTW is not crucial and cannot be effectively mapped to so many distinct parts. As a result, I decided to use an unlatching or momentary switch pedal for this purpose instead.

Later, I decided to utilize DTW for granular synthesis and the chorus section. I assigned different motion patterns to trigger various parts of these effects, ensuring that any misreadings or constant values would not negatively impact the piece. This approach prevents the possibility of silence, as multiple triggers occur in succession based on different movements. To make the process more optimal, I attempted to convert the float output values of the DTW, which typically range from around 3.0 to 13.0, into a single integer state. From the resulting three integer output data streams, I selected the highest or winner value, as it represents the most probable outcome. Additionally, I implemented a timeout mechanism using a gate with a 5-millisecond delay for the on/off cycle. This ensures that the selected winner motion remains active for a short duration, helping to stabilize the output and prevent rapid fluctuations.

As the distinct categories in the classification did not contribute effectively to the compositional process, I decided not to use them for this project. Instead, I focused on working with continuous outputs to manipulate various sections, such as reverb and pitch shift during the piece. But since the outputs were not very smooth, I assumed that the lack of historical data in this type of Wekinator might be the reason, so I considered that providing more past values could lead to more consistent results.

To address this, I mapped the sensors to the DTW and then used 10 data values (7 directly from the sensors and 3 from the DTW outputs) to train another Wekinator for continuous control. Additionally, different port and message names were required for the input and output so that Wekinator could distinguish them from the DTW data.

Figure 2. Max MSP Data Exchange and Configuration For DTW and All Continues Data Types

„Body and Violin Fusion“ – Wekinator VI

After deciding on the types of interactions in the programming part, I realized the need to use machine learning techniques to map more complex gestures and analyze and compare them. I was looking for an external library that could help me with that so I could integrate all parts of the work into a single software. I came across ml.lib7, developed by Ali Momeni and Jamie Bullock for Max MSP and Pure Data, which is primarily based on the Gesture Recognition Toolkit8 by Nick Gillian.

Unfortunately, none of the objects from the package were able to load in Max MSP, and I encountered an error indicating that the object bundle executable could not be loaded. I also discovered that the creators had discontinued support and debugging for the library. However, it appears that the library still works on windows, both in Max MSP and Pure Data and on macOS, only for Pure Data.

Since I had developed all the patches and processing parts in Max MSP on macOS, I decided to work with Wekinator, an open-source machine learning software created by Rebecca Fiebrink, which sends and receives data via OSC. In the early stages, I tried to [pack] all the sensor datas (3x rotations, 3x accelerations and 1x total acceleration) and send/receive them to/from Wekinator via the [udpsend] and [udpreceive] objects.

One important consideration, which is basic but necessary, is to use the same port number for the inputs. If running everything on the same computer, the localhost address is by default 6448. Another key point is that the message name used to send inputs from Max should match with the one in Wekinator e.g., /wek/inputs. The same considerations apply when receiving outputs from Wekinator. Another important factor is that Wekinator needs to know the number of inputs and outputs to properly configure the machine learning model. At this stage, I set it to 7 inputs and chose to receive 3 outputs from Wekinator.

Figure 1. Real-Time Data Exchange and Configuration Between Max MSP and Wekinator

„Body and Violin Fusion“ – Programming V

Additionally, there are other abstractions that I found necessary during the practice phase. For instance, using the [jit.grab] object to digitize video from an external source like the laptop’s front-facing camera to observe my hand movements.

At the end I used a feature found in the Extras menu of Max MSP to record and play back the Max output, as well as another buffer to record the acoustic sound of the violin, for further synchronization and mixing.

Some parts of the patch were placed in abstractions to make the patch clearer and easier to follow for the violinist, as well as to make it more accessible in different sections. This will require opening multiple windows on the screen based on the performer’s preference. Nevertheless, a presentation mode of the main patch can also be considered, offering a simplified, performance-oriented interface that allows the violinist to focus on essential controls and visual elements without unnecessary distractions.

It is also worth mentioning that the function of the pedals (for 8 interactions) for the first 5 parts is to turn each one on/off, meaning the pedal needs to be pressed twice for each. However, for the last 3 parts, only one press is required. A counter number is included in this section to display the current interaction number, helping to prevent confusion while pressing the pedal.

Microsoft Word – Exposé III.docx

Figure 1. An overview of pedals functions and interactions in Max MSP

„Body and Violin Fusion“ – Programming IV

The programming strategy was to begin by recording the violin to gather materials for further processing during the piece. I used four buffers (with applied Hanning windows to smooth the edges of the signal), recording into them sequentially for later looping. The buffers will be triggered via a pedal, which activated each buffer one after the other using a counter.

After recording into the four buffers, the gate for pitch shifting of one or two buffers would open, as they contain more low-frequency content, making the pitch shift more noticeable. The pitch shift was controlled in real-time using sensor data, specifically the Y-axis rotation parameter.

After exploring pitch shifting while playing the violin, the next gate will gradually increase the reverb gain over 10 seconds, rising from -70 dB to -5 dB. The reverb parameters (size, decay time, high-frequency damping and diffusion) are controlled by real sensor data, including the Y-axis rotation. The core concept of the reverb patch is inspired by the [yafr 2] as a plate reverb by Randy Jones, in the style of Griesinger, and is part of the Max MSP library.

Next, I applied another gain adjustment using the same approach over 20 seconds to gradually introduce the chorus and granular sections. For this part, I primarily used DTW data from Wekinator to switch between different granular synthesis patches, while real sensor data controlled the chorus via the X-axis rotation parameter. The setup includes six granular synthesis patches, triggered at varying tempos. Three of these patches feature randomized start/stop (grain positions) and duration settings, creating diverse densities and sizes of the grain with or without pitch shifting and reverse effects. The remaining three granular patches have their parameters controlled by the Y-axis rotation sensor. In this section, the resulting sound creates harmony across different frequency ranges.

“ontextC” – Technical Diary 10

What happened so far?

For the exhibition, I set up an interface with a parameter slider with values relative to the actual value. I set up the software so the reference audio alternates between a stretch factor of 110 and 25 every time someone saves their result, to get an idea of how good the recognition resolution is at higher values. I noticed in my testing stage with myself that in the last third of the values, my own guesses strayed a bit further from the actual parameter value, whereas in the lowest third they were usually very accurate.

The final exhibition setup in presentation mode (Picture credit: Mahtab Jafarzadehmiandehi)


Since I would not be able to be present for the opening myself, I added a minimal interface in the patching mode so my colleagues would be able to save the data at the end of the day.

Max interface for saving the collected data

For the exhibition setup, I rented an iPad, a laptop, and an iPad stand, and I ran Cycling’74’s Mira app on the iPad with guided access enabled. Like this, I could pretty much maintain the GUI I had set up in Max’s presentation mode already, with some minor changes (e.g.: changing slider objects into Mira-compatible live.slider objects). Initially, I wanted to try connecting the laptop and iPad via Wi-fi to be more flexible with the placement of the laptop on site, but ultimately connecting the two devices via USB was a safer option, especially since I also had to consider the ease of setup for my colleagues on site.

Building the test setup for the exhibit at home

I also fastened a hook onto the iPad stand using zip ties to be able to hang a pair of headphones there. On-site, a white box with a hole in the middle for the cables was put over the laptop to protect it and give the exhibit a clean look. I recorded a video of myself explaining and turning the exhibit on and off in advance, so my colleagues could have it as a reference when setting up.

When I returned, I found that there had been some issues with turning the exhibit off and on some days, and some of the data was unfortunately lost because it had been overwritten in my absence. Luckily, the data for two days remained available, leaving me with a total of 31 test results (16 for the factor of 110 and 15 for the factor of 25). As expected, the results were a little bit all over the place, since of course an exhibition is also an informal setting that can (and should) invite people to primarily explore, but I was also able to detect some subtle trends of the nature that I had observed with myself. Of course, with this small sample size and setting it is not recommended to come to fixed conclusions, since there are just so many uncontrolled variables, but it was still interesting to see how some people seemed to have used the tool and that they did in fact try it out.

Ongoing

Now it is time to properly discuss and evaluate the test setup and the data results, as well as reflect on the overall process of creating the Max4Live device. There is still some work that I want to do for the GUI, and I also want to clean up the cord connections in my Max patch to make them easier to trace for others in case I ever do decide to share the patch. Lastly, I would like to prepare sound examples to show during the presentation in advance.

Results and Reflection

The exhibition setup was definitely a new experience for me, since it forced me to articulate my process in a way that could be understood by any other person, and I also needed to provide documentation that would enable people to use the setup regardless of me being available on site or not. Of course, it was unfortunate that I missed out on the larger amount of data from the opening, but I am glad that there is at least some data from days when I received confirmation that the exhibit worked as intended – the whole process really added a new layer of learning outcomes to the project for me. Not only did I have to figure out data collection in the Max environment, but I also learned about an application I had been unfamiliar with before, thought about setup considerations in a real location (safety, cable management, exhibit design) and took mental notes on how the process of saving data could be simplified for other projects.

Objectives for Next Time (= the final presentation)

  • Document project implementation
  • Finalise GUI
  • Prepare presentation

“ontextC” – Technical Diary 9

What happened so far?

Recently, time spent working on the project was dedicated to figuring out how to best turn it into an exhibit that is both somewhat valuable for the user, as well as for research purposes. I knew that it would be important to keep the interface intuitive, and at the same time not to clutter it with information. Furthermore, a good solution was needed to collect parameter data – after some research and experiments I found that the coll object would work best for my purpose, with its ability to capture an index number and separate data input with commas, allowing me to then export the anonymous results as a CSV file. The save button and volume adjustments were non-negotiable, but I struggled a bit with how to best implement options to play back the source sound as well as the processed sound in a way that made sense just from looking at the interface. Another aspect I considered was that I would need a “phantom” slider for the visible interface for the user, meaning that after the previous person saves it always jumps to a random value, but looks as if the slider is back at the center. Like this, test subjects cannot copy the results from the previous person and really have to rely on their hearing to match the processed audio as closely as possible to the source sound.

Preliminary interface for the exhibition/survey

Ongoing

During a supervisor meeting, we tried think of a way to improve the playback situation – ideally three buttons at the centre of the screen would be enough. One option would be to have the playback of the original sound be gated, so that whenever it stops playing, the processed sound starts automatically. It is definitely something that still needs more thought and a better practical solution.

Results and Reflection

That this part of the project will be shown to the public definitely added a new challenge, because now it is not just about whether the software makes sense to me, but also whether it can be translated to a first-time user with little to no experience. The idea of people using their hearing to adjust the parameter in a sort of audioscope-like manner is very interesting to me though, and I look forward to seeing the results – I wonder how accurate the resolution of the parameter has to be for people to not notice a significant difference anymore, and how much it varies between people.

Objectives for Next Time

  • Finalise exhibit version (software)
  • Figure out physical exhibition setup
  • Write guideline how to set up/turn the exhibit off and on for the showcase supervisors

“ontextC” – Technical Diary 8

What happened so far?

After building a working signal chain with the vb.stretch~ external, I worked on fine-tuning some bugs that I had noticed in the patch, but so far had not been given priority treatment because the signal chain had not been fully functional previously. This included adjusting the filter indexes in the parametric EQ to reflect the features I wanted for my production process (1 – low shelf, high pass, 2 – bell, 3 – bell, 4 – high shelf, low pass), correcting the units and patching in the pitch shift unit to reflect semitone and cent adjustments separately, and implementing a line object on the reverb faders to remove crackling while changing a parameter. Then I started working on the patch in presentation mode to represent only the parts of it which I also wanted accessible during my production process. To do this, I worked with my initial sketch from the first semester, the GUI capabilities within Max and Max4Live for cross referencing the result. I also tried to somewhat make the signal flow (in series) clear through the interface, but it definitely still needs some cleaning up. This necessity was also reflected during my first testing session with a Max4Live export in Ableton Live, but it was good to see that the parameter selection was already working quite well for my production process, as I had hoped. I also managed to set up a simple preset function (but I am hoping to advance that as well with proper dropdown menu presets).

Rudimentary GUI loosely based on my original sketch, using internal Max GUI tools.

Ongoing

Off the basis of this patch, I am starting to plan out the look and feel of the exhibit version, where only one parameter will be adjustable (probably the stretch factor). Considerations for this endeavour are: usability, how playback of the source sound and the processed sound should be triggered, an index number for survey content and a volume adjustment to cater to individual hearing sensitivity.

Results and Reflection

This stage of the process was very exciting! The testing stage made me remember why I had wanted to set out on this process in the first place, and it was very satisfying to hear the first working results playing back through my DAW. Since it was also my first time seriously working on a graphical user interfaces, that came with new challenges and insights, and I look forward to where my GUI research and testing will lead me.  

Objectives for Next Time

  • create mockup for exhibit version
  • figure out an effective play/stop mechanism for alternating between the processed and original sound
  • test GUI and figure out which changes to make in which order (also consider typography, style…)

“ontextC” – Technical Diary 7

What happened so far?

While I managed to get a (very imperfect, but at least audible) signal through my phase vocoder pfft patch, changing the FFT size manually and incrementally while playing the audio was not possible within its framework. I researched options for this, and found that something similar to the block~ object in pure data might help fix this problem, but unfortunately all the equivalents or similar objects I found during my search did not work for this purpose, so I had to look into other options. I briefly considered writing an external, but quickly realized that this would require a whole new toolbox and set of skills, which would not work within the timeframe I had set for myself. But during the time I studied max patches from others I stumbled across a promising option: Volker Böhm’s vb.stretch~, an external which is based on the Paulstretch algorithm and provides the parameters I had wanted to include in my compiled plug-in anyways. I was not entirely sure why I had not stumbled across it earlier during my research, because I had already looked for externals once, but decided to try it out in the context of my patch and came up with sounds results that were so far the most similar to what I was looking (or in this case listening) for.

Exploring the parameter options of the external

Ongoing

With a working patch, now the plan is to fine tune parameters, iron out inconsistencies and get a more refined prototype with a simple GUI working.

Results and Reflection

Honestly, while I was glad to have found a solution with sound results I liked, I initially felt a bit disappointed and discouraged that my intended solution did not work out the way I had wanted it to, since I had already put so many hours into exploring and setting it up. But that is part of an iterative process, and it is a process I have learned a lot from – much more than had I immediately found the external. The current setup allows me to more freely explore and improve other aspects of the patch, and gives me more time to work on usability and actually using and testing the patch in my own productions.

Objectives for Next Time

  • fix EQ inconsistencies and pitch shift units
  • look into and start setting up a (simplified) GUI for testing in the form of a max4live device
  • plan which parameters might be best to explore for the exhibit