What happened so far?
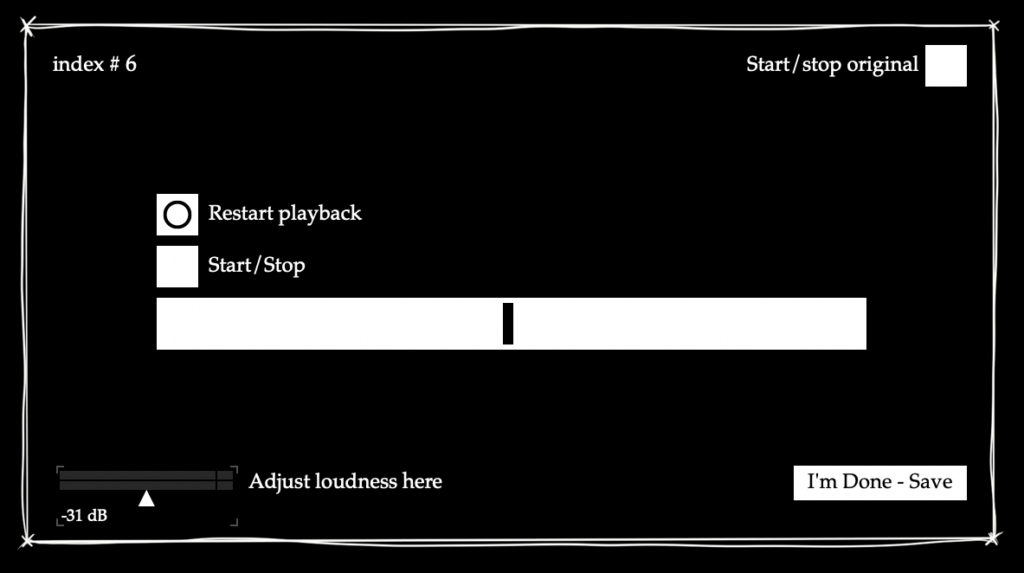
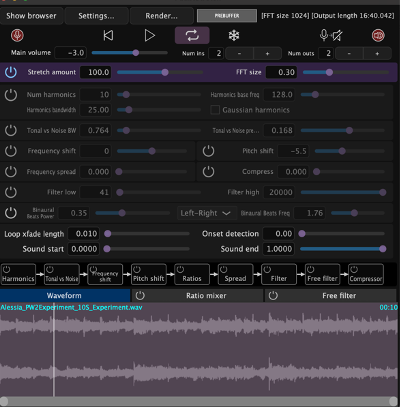
For the exhibition, I set up an interface with a parameter slider with values relative to the actual value. I set up the software so the reference audio alternates between a stretch factor of 110 and 25 every time someone saves their result, to get an idea of how good the recognition resolution is at higher values. I noticed in my testing stage with myself that in the last third of the values, my own guesses strayed a bit further from the actual parameter value, whereas in the lowest third they were usually very accurate.
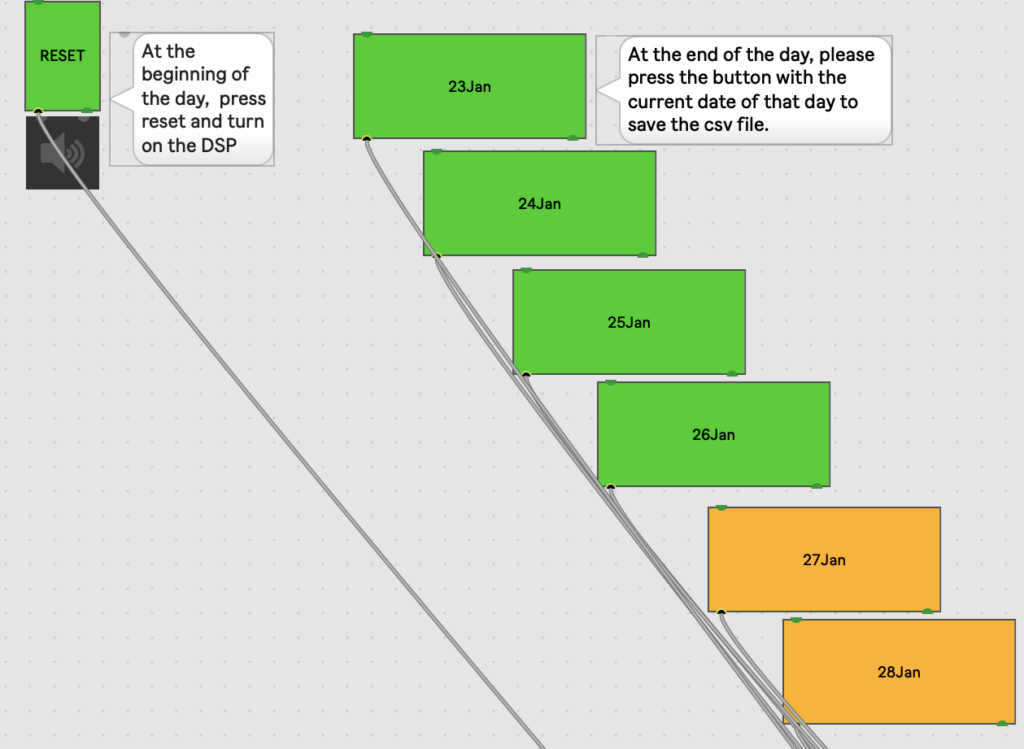
Since I would not be able to be present for the opening myself, I added a minimal interface in the patching mode so my colleagues would be able to save the data at the end of the day.
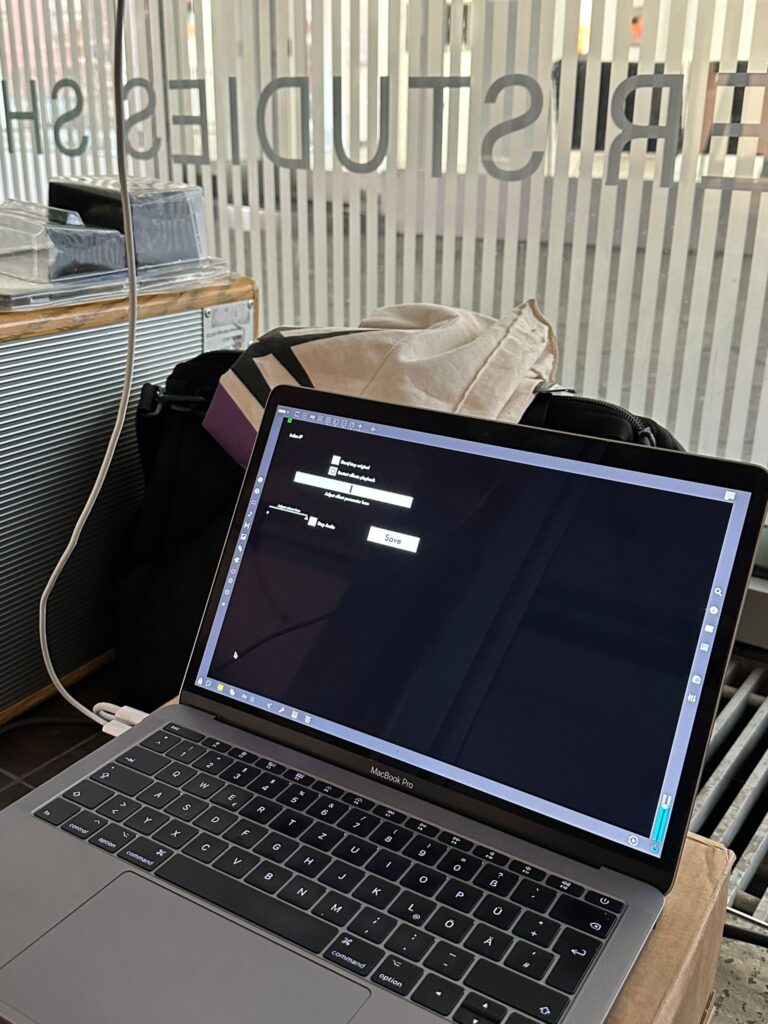
For the exhibition setup, I rented an iPad, a laptop, and an iPad stand, and I ran Cycling’74’s Mira app on the iPad with guided access enabled. Like this, I could pretty much maintain the GUI I had set up in Max’s presentation mode already, with some minor changes (e.g.: changing slider objects into Mira-compatible live.slider objects). Initially, I wanted to try connecting the laptop and iPad via Wi-fi to be more flexible with the placement of the laptop on site, but ultimately connecting the two devices via USB was a safer option, especially since I also had to consider the ease of setup for my colleagues on site.
I also fastened a hook onto the iPad stand using zip ties to be able to hang a pair of headphones there. On-site, a white box with a hole in the middle for the cables was put over the laptop to protect it and give the exhibit a clean look. I recorded a video of myself explaining and turning the exhibit on and off in advance, so my colleagues could have it as a reference when setting up.
When I returned, I found that there had been some issues with turning the exhibit off and on some days, and some of the data was unfortunately lost because it had been overwritten in my absence. Luckily, the data for two days remained available, leaving me with a total of 31 test results (16 for the factor of 110 and 15 for the factor of 25). As expected, the results were a little bit all over the place, since of course an exhibition is also an informal setting that can (and should) invite people to primarily explore, but I was also able to detect some subtle trends of the nature that I had observed with myself. Of course, with this small sample size and setting it is not recommended to come to fixed conclusions, since there are just so many uncontrolled variables, but it was still interesting to see how some people seemed to have used the tool and that they did in fact try it out.
Ongoing
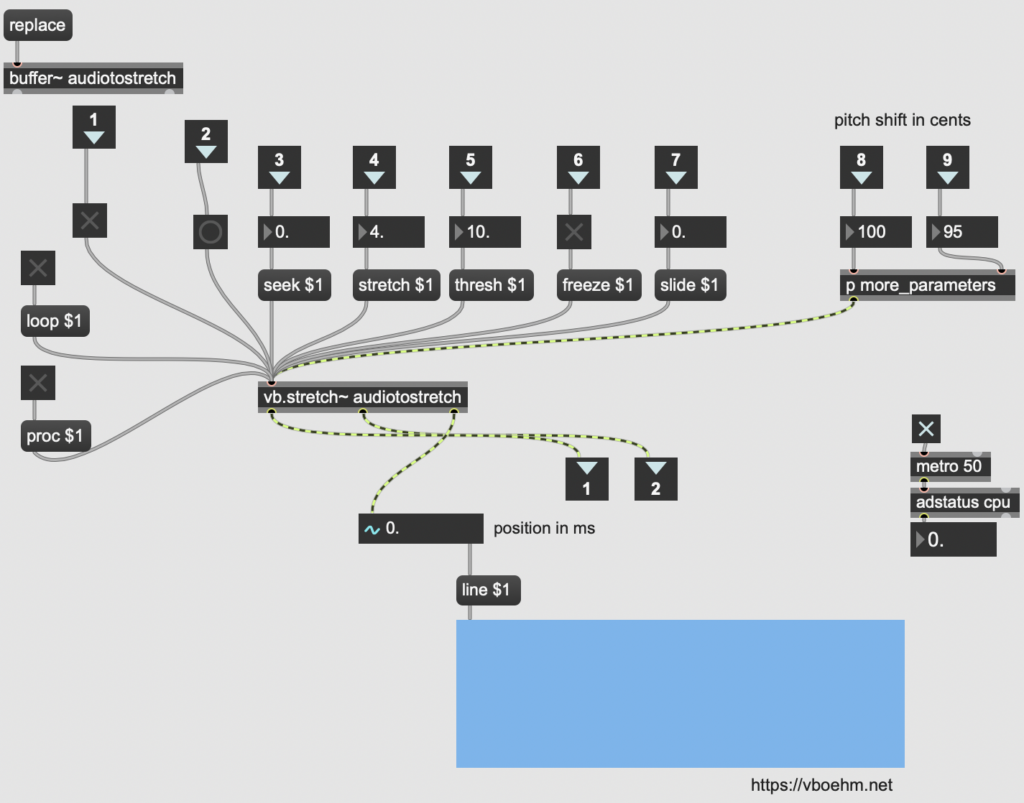
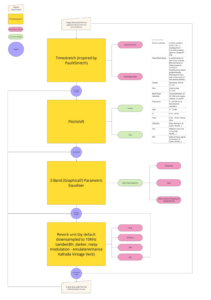
Now it is time to properly discuss and evaluate the test setup and the data results, as well as reflect on the overall process of creating the Max4Live device. There is still some work that I want to do for the GUI, and I also want to clean up the cord connections in my Max patch to make them easier to trace for others in case I ever do decide to share the patch. Lastly, I would like to prepare sound examples to show during the presentation in advance.
Results and Reflection
The exhibition setup was definitely a new experience for me, since it forced me to articulate my process in a way that could be understood by any other person, and I also needed to provide documentation that would enable people to use the setup regardless of me being available on site or not. Of course, it was unfortunate that I missed out on the larger amount of data from the opening, but I am glad that there is at least some data from days when I received confirmation that the exhibit worked as intended – the whole process really added a new layer of learning outcomes to the project for me. Not only did I have to figure out data collection in the Max environment, but I also learned about an application I had been unfamiliar with before, thought about setup considerations in a real location (safety, cable management, exhibit design) and took mental notes on how the process of saving data could be simplified for other projects.
Objectives for Next Time (= the final presentation)
- Document project implementation
- Finalise GUI
- Prepare presentation