Since the last blog post, I’ve spent some time on various platforms like Instagram, YouTube, and Pinterest, drawing inspiration. As a result, I developed two new visualizations using TouchDesigner for the prototype. I would like to introduce them to you now.
Plasmasphere
The idea behind this visualization was to create a sphere that changes with the values. The more negative the values, the more chaotic the representation should be, and vice versa. To achieve this, I followed a YouTube tutorial by Bileam Tschepe. This visualization is built on the ParticlesGPU component and has been enhanced with various settings. Additionally, I programmed the controller using Python scripts. By rotating the controller, you can change the values, and with the button function, you can change the values without affecting the visualization in real time or reset them to their original state. The screenshot below shows the TouchDesigner project.

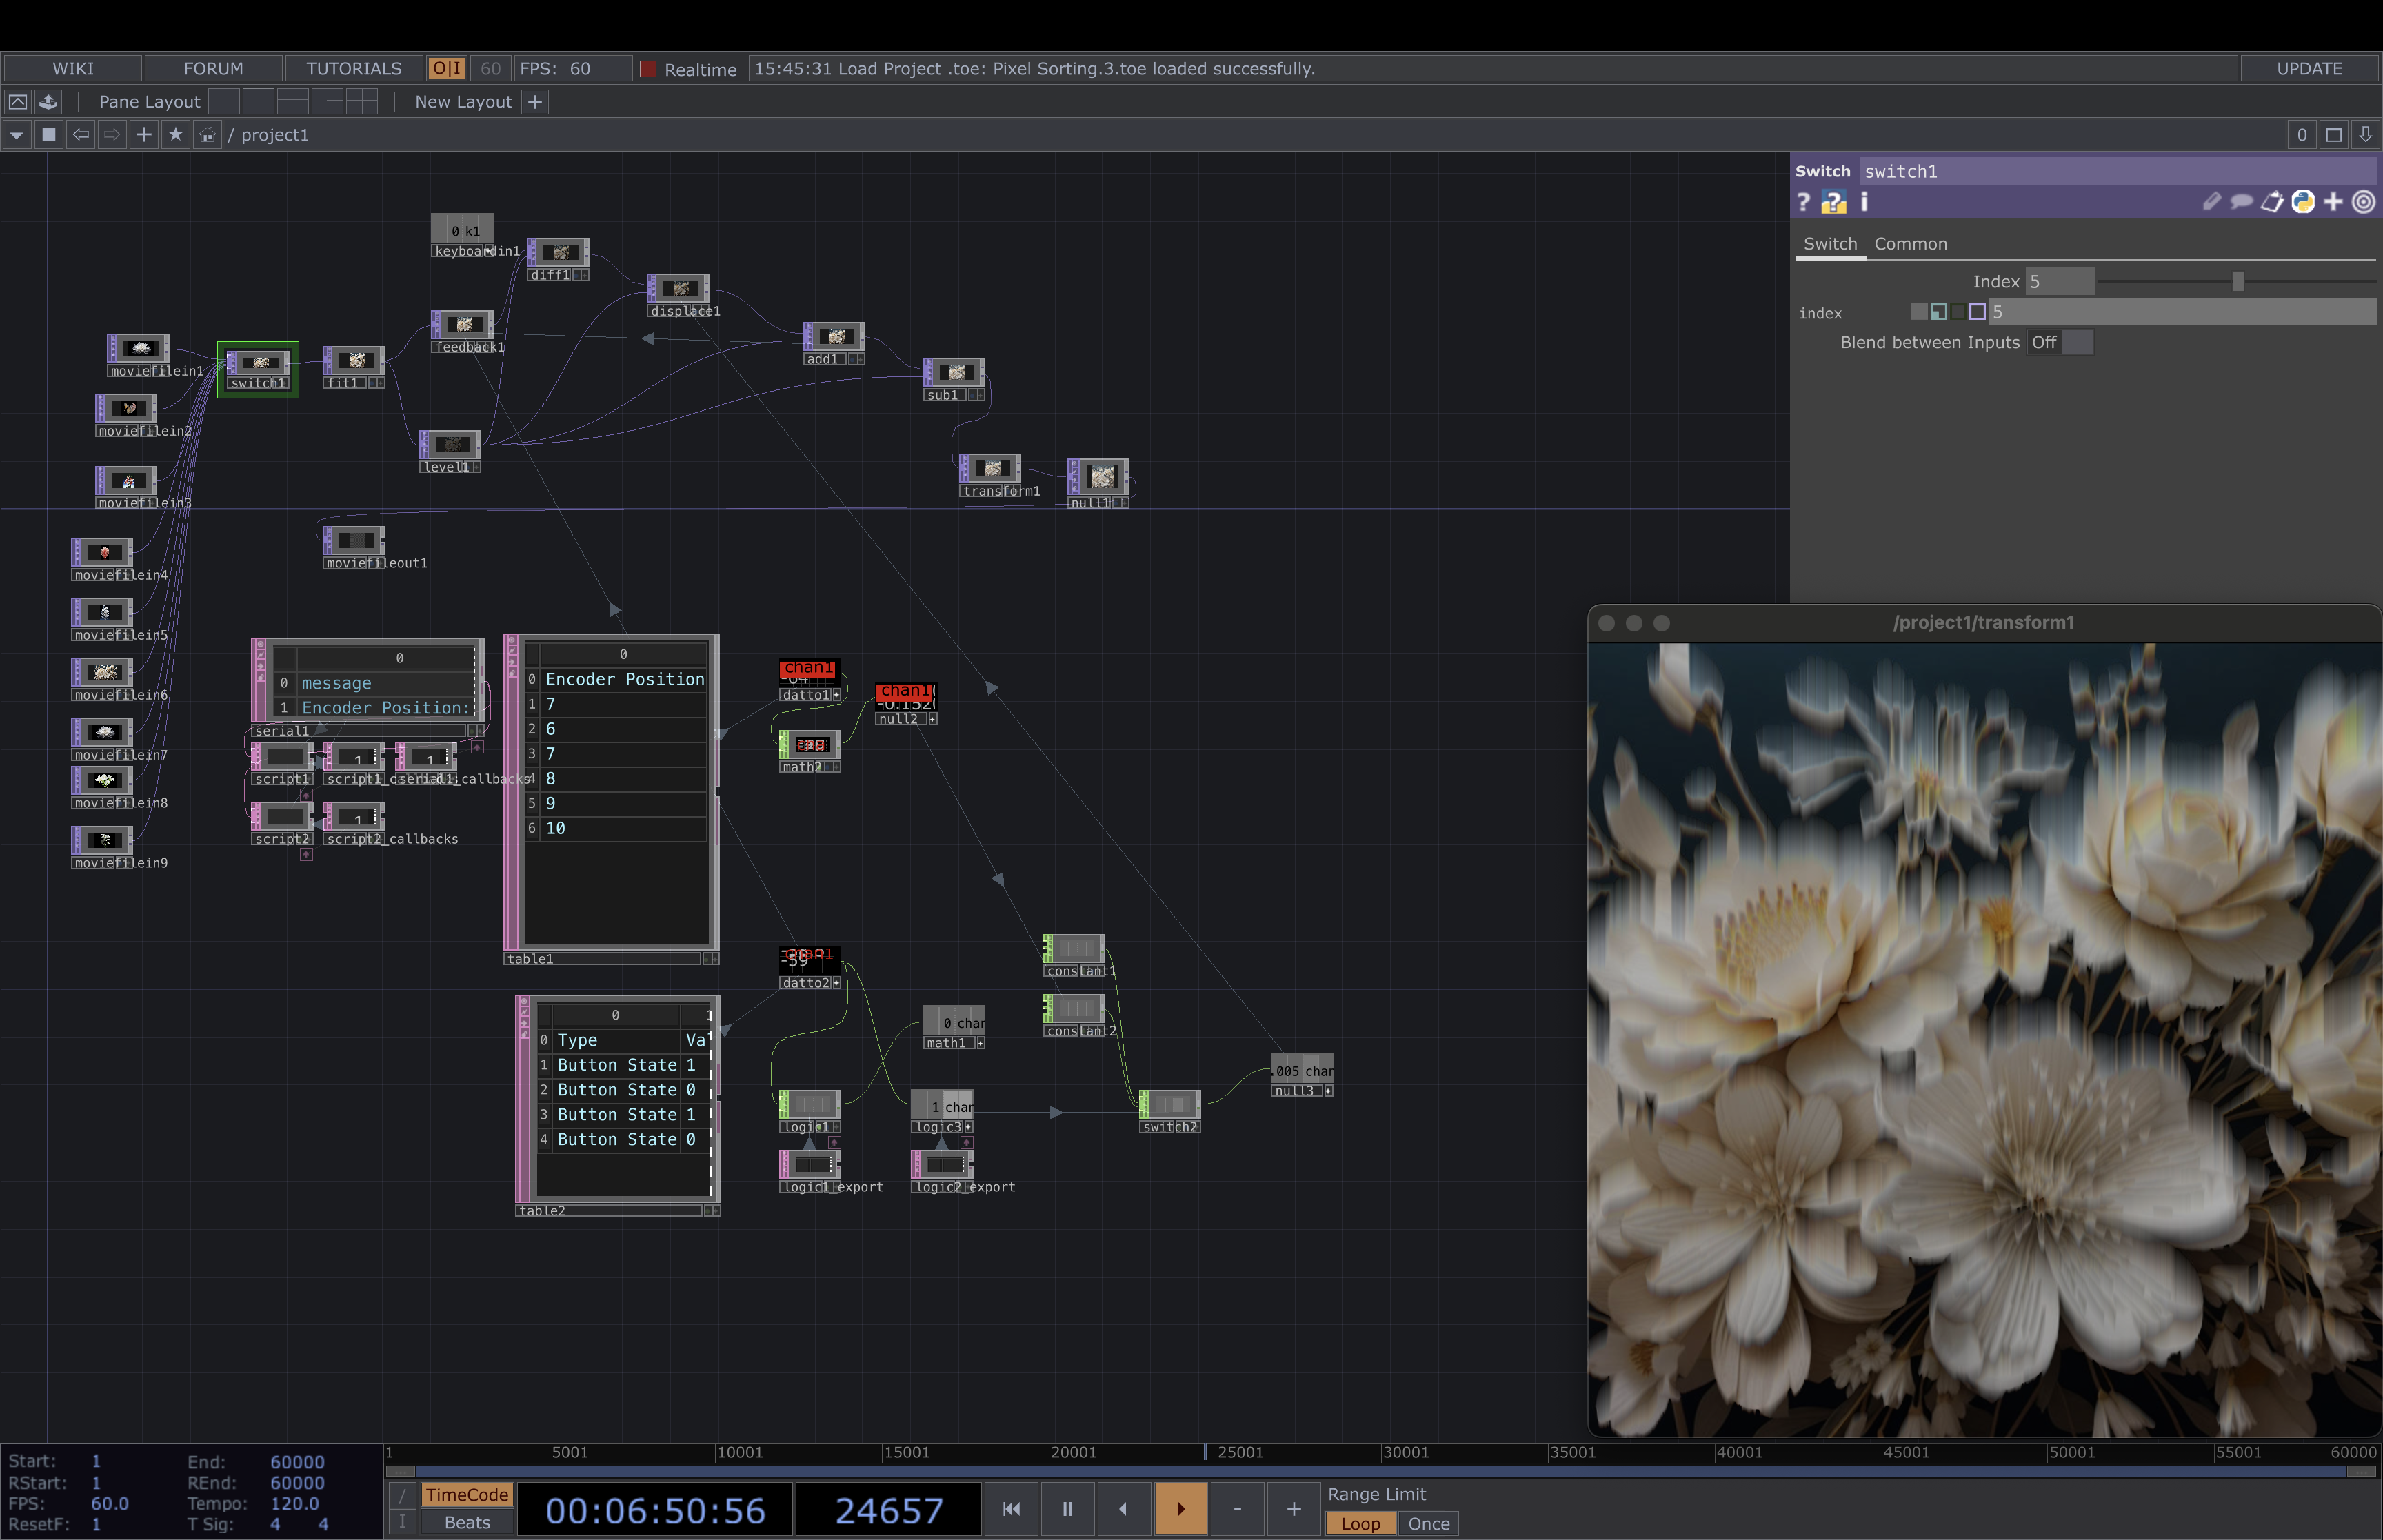
Flowers
The concept behind this visualization is that flowers wilt when they are not properly cared for, much like how our Earth deteriorates if we do nothing about the global climate crisis. Therefore, I used various photos and AI-generated images of white flowers and applied the pixel sorting method to simulate wilting. The more negative the data, the faster and more intense the wilting becomes. This is the first visualization that somewhat relates to the subject matter being addressed. The TouchDesigner project is shown below.
