Tamara Munzner says the definition of visualization is: „Computer-based visualization systems provide visual representations of datasets designed to help people carry out tasks more effectively.“
Why? Is It interesting?: Data and People in the same sentence
We do not need visualization when…:
A) …fully automatic solution exists
B) …fully automatic solution exits and is trusted
Why use external representation?
- external representation=replace cognition with perception
- Replace cognitive Acts with perceptional acts in order to free up cognition for more interesting higher level questions
Example Table full of Numbers:
– Goal is understand some overall structure of those Gene Expression levels
– to read a number, remember it, read the next number, remember that, compare to the other……… (We pretty fast would run out of short-term slots storage in our head) -> Cognitive Act that is quite demanding
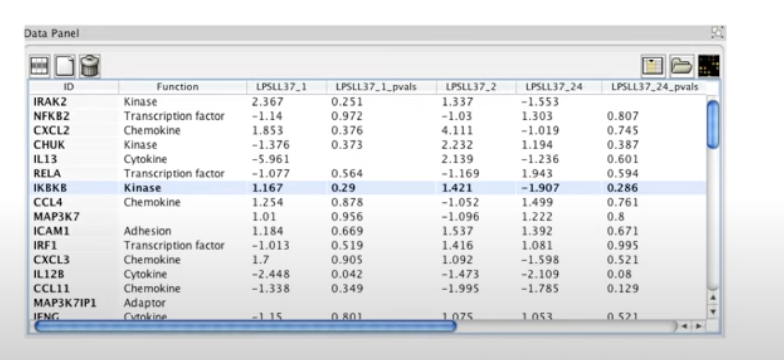
Versus Replacing the cognition with perception

Why depend on vision?
Human visual system is high-bandwidth channel to brain. Overview possible due to background processing (subjective experience of seeing everything simultaneously, significant processing occurs in parallel and pre-attentively).
Why represent all the data?
Summaries often lose information, details matter. Visualization can confirm expected and find unexpected patterns. Also it asses validity of statistic model.
When we have data we need some real-world meanings (Semantics)
Resources Limitations?
- Computational limits
- Display limits: 1. pixels are precious & most constrained resource, 2. information density (ratio of space used to encode info vs unused whitespace, tradeoff between clutter and wasting space, find sweet spot between dense and sparse)
- Human limits: human time, human memory, human attention (focus- attend)
Why analyze?
Imposes Structure on huge design space: Scaffold to help you think systematically about choices, analyzing existing as stepping stone to designing new, most possibilities ineffective for particular task/data combination
Dataset types
Tips: Figure out your Dataset Typ and understand mental construction (Semantics)
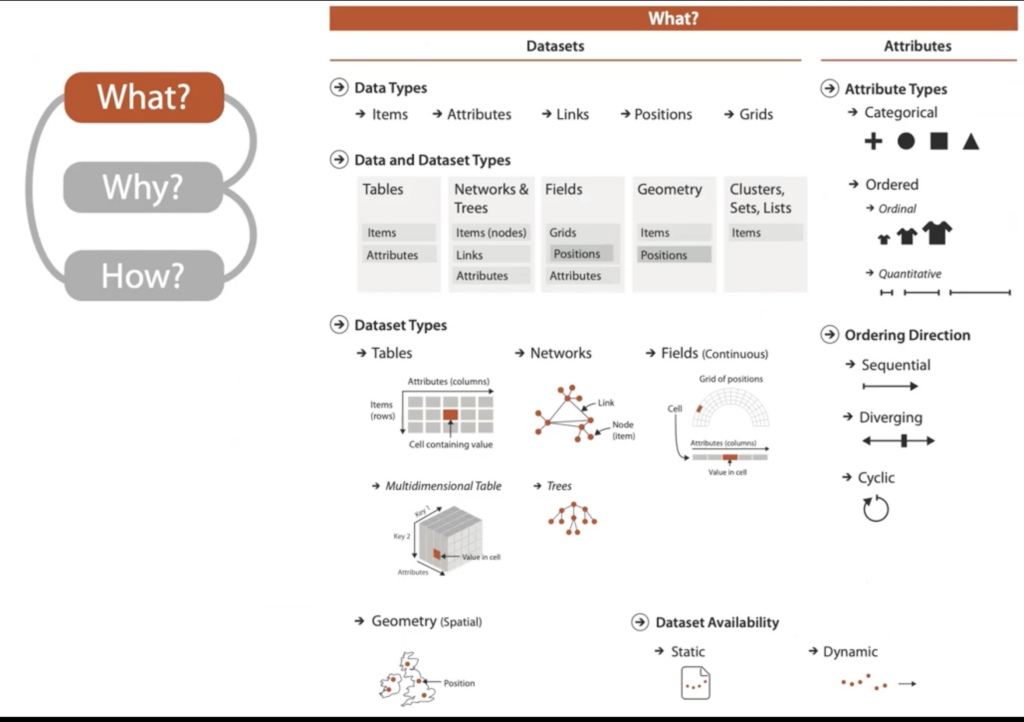
(Cyclic: e.g Seasonal Data or Direction of wind)
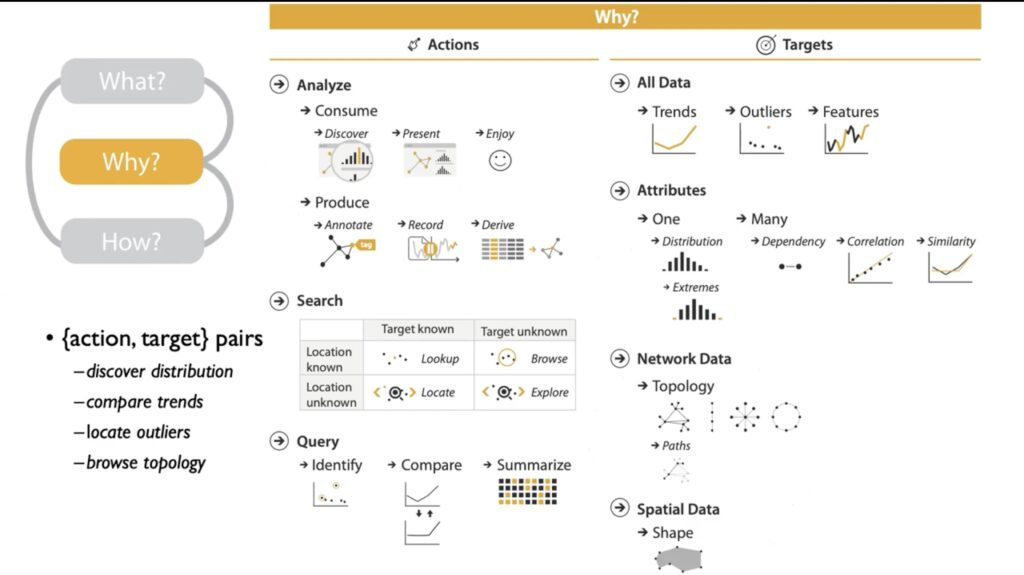
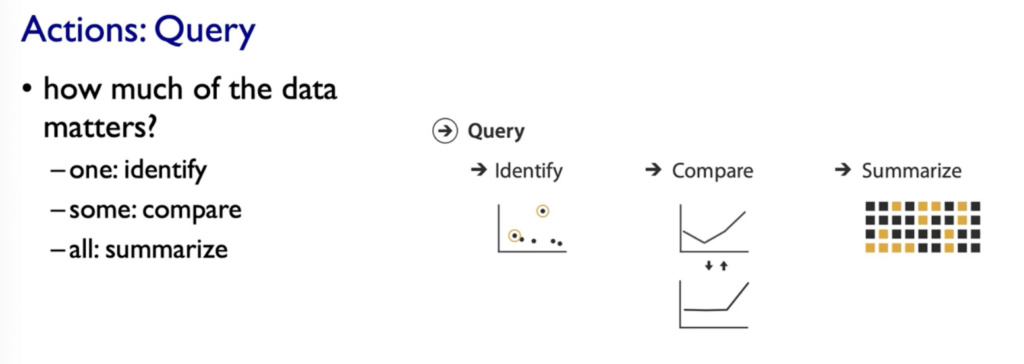
HOW TO START:
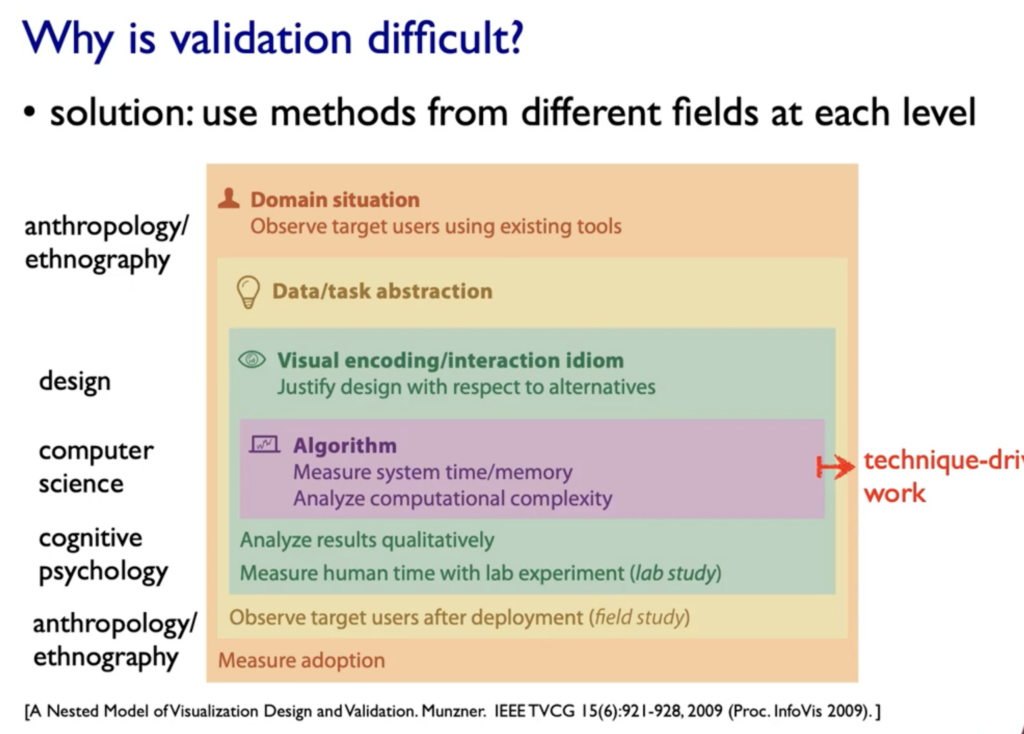
- Who Are The Target Users: ?
- What is Shown: Data Abstraction
- Why is the user looking at it: Task Abstraction
- How is it shown: Visual Encoding(how to draw it) & Interaction (how to manipulate) -> Part 2
Source:
Tamara Munzner. (2021, 06. November). Visualization Analysis and Design, 2021, All Lectures[Video]. YouTube. https://www.youtube.com/watch?v=KCqgErJbeXY