→ Impulse_05 | Movie (Arrival)

Since my thesis is about how languages can „look,“ I thought it would be a good idea to rewatch the movie Arrival. I saw it a few years ago, but now I wanted to focus on its connection to language and visualization. Even though the movie is about aliens, it has a deeper message about how language works and how it can change the way we think and understand the world.

The movie is about a linguist named Louise Banks, who is asked to help communicate with aliens that have arrived on Earth. These aliens, called Heptapods, have a unique way of writing and speaking. Louise’s job is to figure out their language so humans can understand what they want. But the story is not just about aliens—it’s also about how learning a new language can affect your mind and even the way you see time.

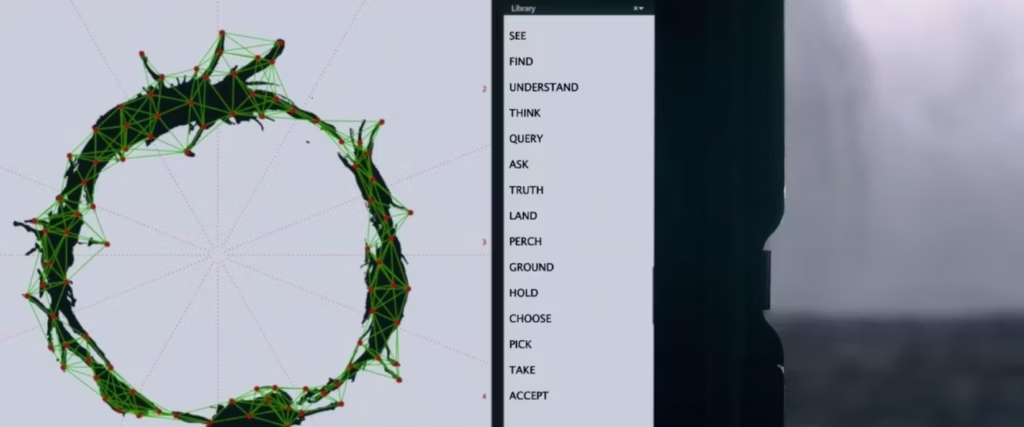
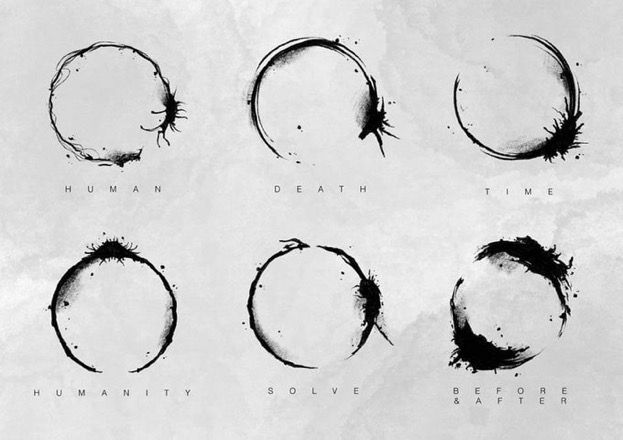
Attention spoiler alert🚨 One of the most memorable scenes for me was when Louise communicates with the Heptapods by touching the screen. Their written language is shown as circular symbols called logograms. These symbols are not written in a straight line like most human languages. Instead, they are designed to show the full meaning all at once, without following a specific order which is very interesting.

Idea of a nonlinear language really made me think about how I could visualize the sounds and meanings of different languages in my thesis. I also learned the term „logogram,“ which I guess, I didn’t know before. Now I want to research more about how other writing systems work, especially ones that are very different from the alphabets we use every day.

  • The term logogram refers to symbols that represent a word or concept.
  • Language can shape how we think and even how we experience time, which connects to the Sapir-Whorf Hypothesis.
  • Visualizing a language in a new way, like the Heptapod logograms, can make us question our usual way of thinking about communication.

Overall, I really enjoyed watching Arrival again with an observation eye through language. Also it was visually appealing! I would recommend this movie if you are interested in science-fictions and aliens as well 🙂

→ Watch the Trailer: Arrival – Official Trailer

→ Impulse_04 | Technisches Museum Wien

On November 30th, Mert and I visited the Technisches Museum Wien. There were several exhibitions, and luckily, we found some that fit our thesis topics. I was especially interested in how they designed the different exhibitions with different themes using interactive screens and installations. Even though some of them looked old, they were still inspiring!

One artwork that stood out to me was from the Musical Instruments exhibition. It showcased creativity, craftsmanship, experimentation, tradition, and the unique sounds of different instruments. The exhibit had a microphone hanging from the ceiling that captured the sound of the instruments and turned it into visuals. This was a great example of real-time data visualization, which really caught my attention.

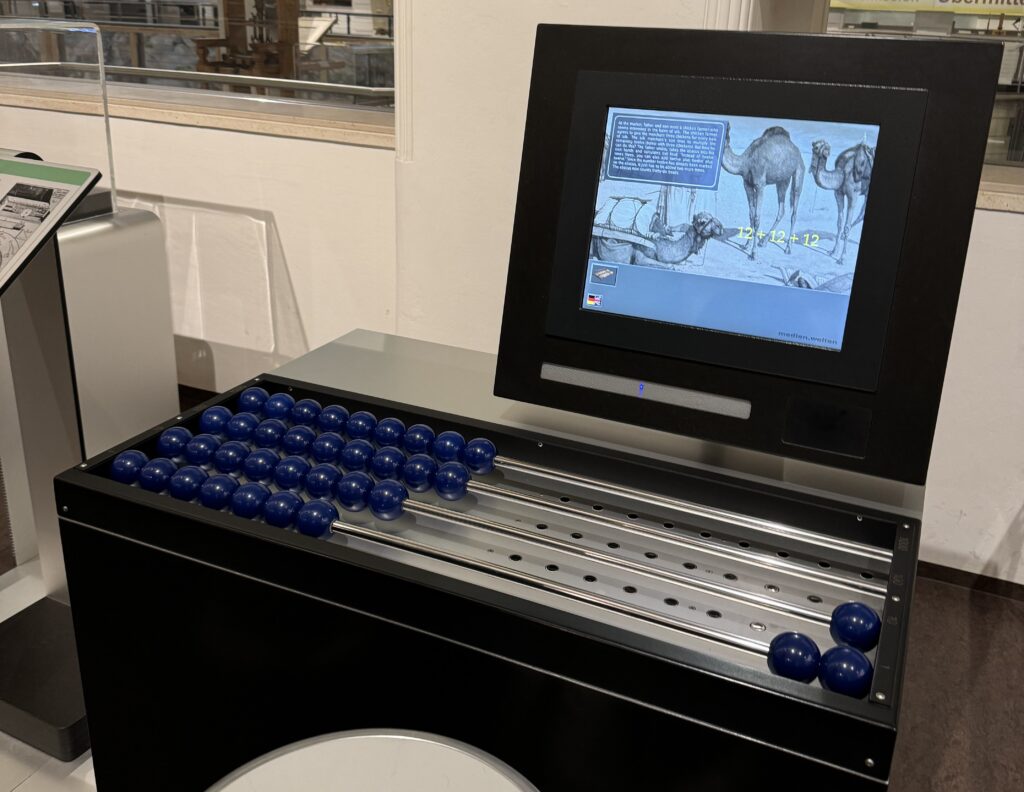
Another inspiring part was the Media Worlds exhibition, which explored the history of media and its impact on society. It covered everything from early communication tools like the post and telegraph to modern inventions like computers and the internet. I had the chance to closely examine how interfaces and ways of interaction have evolved over time. There were also some interactive games, which I really enjoyed.

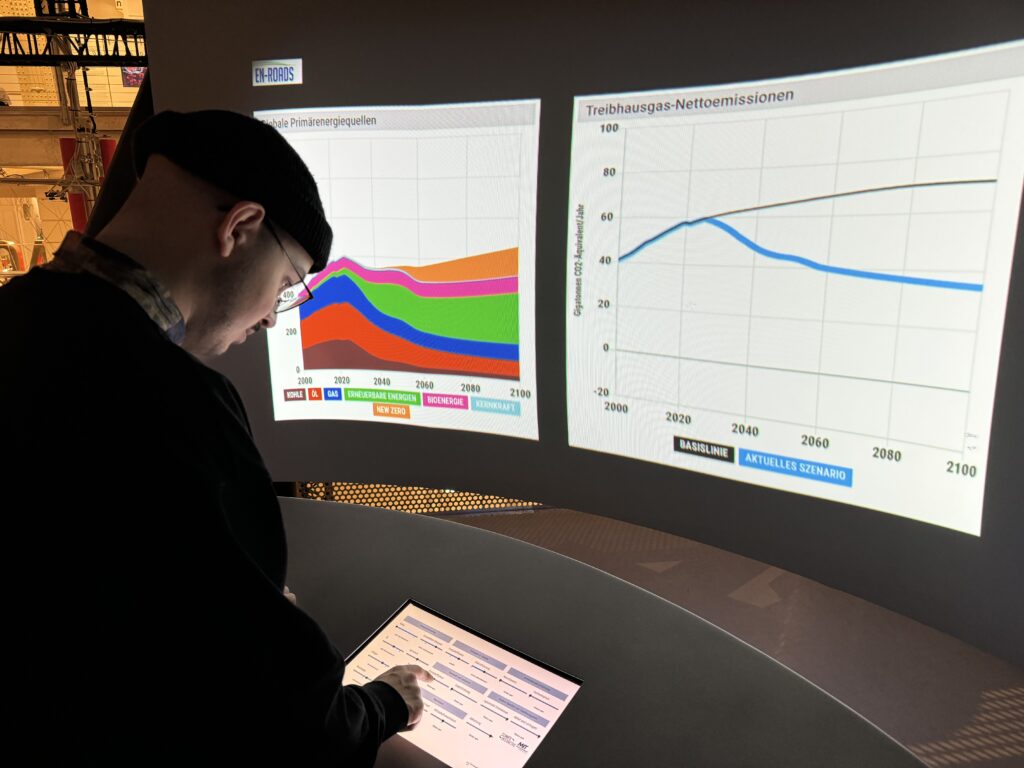
Also, the Energiewende exhibition and some others had very good examples of data visualization, even though they were not interactive. These examples showed how complex data could be made easier to understand through simple, effective visual representations. It was a reminder of how powerful data visualization is in communicating ideas and information clearly and effectively.

The visit to the Technisches Museum Wien gave me some inspos into interactive design and data visualization. I thought again how combining sound and visuals can create an engaging, real-time experience, and how effective data visualization can make complex information more accessible. The exhibitions helped me to have an idea about how I can apply these concepts to my thesis.

Overall, the museum visit was very fun with Mert! We spent almost 4 hour there, it was tiring yet so interesting!! Luckily, we got inspired about our future thesis!

🟦 08_Prototype

After analyzing the audio-reactive visuals, I wondered how I could apply these outcomes practically. While creating an app might seem like an easy route, I wanted to explore how it would look and function in this context.

App Prototype

I designed a demo app prototype using Figma:

  1. Home Screen: Native Language Selection
    • Users start by selecting their native language.
  2. Language Learning Selection
    • Next, users choose the language they want to learn. This screen ensures that the app tailors the visualizations and pronunciation guides to the selected language.
  3. Start Pronunciation Practice
    • The final page displays the data visualized video that I made in TouchDesigner. There is a simple prompt: „Hold to Pronounce.“ This allows users to practice pronunciation and see the visual feedback in real-time.

I made a quick prototype because for me the process and learnings from TouchDesigner was more challenging and interesting.

Next Step

I plan to write about my learnings and reflect on the overall process.

🟦 07_Analysis of Outcome

After experimenting with AI voices and creating audio-reactive visuals for different languages, the next step is to analyze the outcomes in detail. Here’s how I approached the analysis and what I discovered.

Collecting and Comparing Data

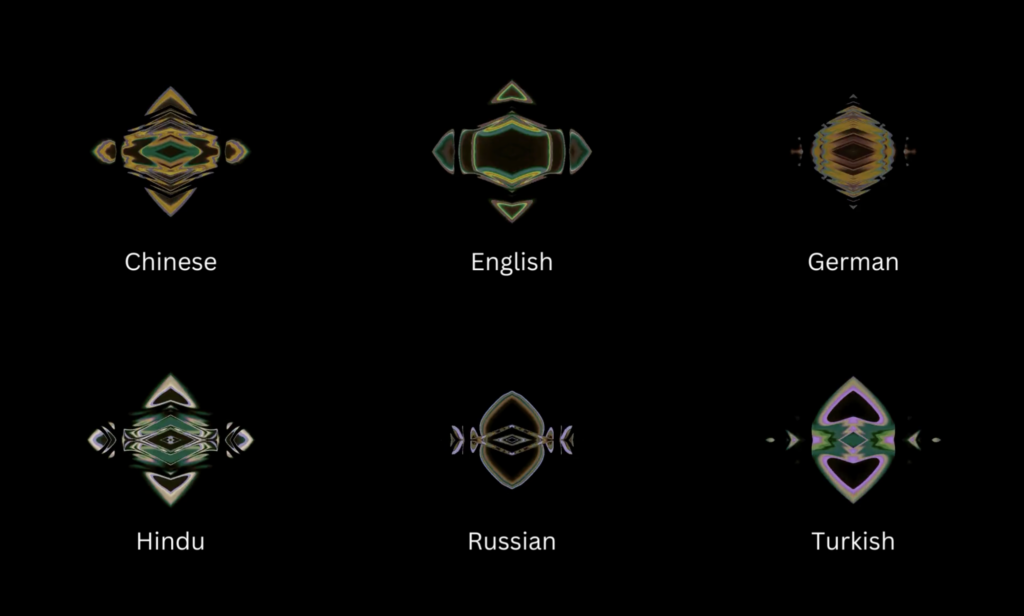
First, I recorded of the visuals for each language and phrase under consistent conditions. By placing these visuals side by side, I could directly compare them. I looked for patterns, shapes, and movements unique to each language, paying special attention to how the visuals reacted to specific sounds, particularly vowels and consonants.

Observations and Differences

During my analysis, I noted some differences:

  • German and English: Both languages produced clear, structured lines. However, German visuals had slightly more detailed patterns.
  • Turkish: Turkish visuals showed more fluid and continuous lines, reflecting its smooth flow and connected structure.
  • Russian: Russian visuals had a mix of sharp and smooth lines, showing its varied sounds and pronunciation.
  • Hindi: Hindi visuals displayed intricate and dense patterns, likely due to its mix of different sounds.
  • Chinese: Chinese visuals featured rhythmic, wave-like patterns, capturing the tones and unique structure of the language.

Here are some examples of the outcomes for „hello“ and „how are you?“:

  • German: „Hallo, wie geht’s?“ – Clear and structured lines with some complexity.
  • English: „Hello, how are you?“ – Similar to German but slightly less complex.
  • Turkish: „Merhaba, nasılsın?“ – Fluid lines, continuous patterns.
  • Russian: „Привет, как дела?“ – Mix of sharp and smooth lines.
  • Hindi: „नमस्ते, आप कैसे हैं?“ – Dense, intricate patterns.
  • Chinese: „你好, 你好吗?“ – Rhythmic, undulating patterns.

Next Step

Analyzing the audio-reactive visuals revealed subtle yet fascinating differences between languages. Each language’s phonetic characteristics influenced the visuals in unique ways. Moving forward, I want to gather some feedback from people around me where these visuals can be used and what they think about the visuals so far.